

By: Nabarun Dasgupta, Colin Miller, Adams Sibley
A good analogy is inflation: It's hard to trust official numbers unless we feel it in our wallets. Or in this case, our hearts.
Are we going to fewer funerals? Donating to fewer memorial funds? Getting fewer dreaded late night phone calls? Maybe.
But we've been here before. Excitement about dips in overdose indicators end up being transient or explained away by data artifacts. So pardon our skepticism.
Let's be clear: Too many people we love are still dying from overdose. Any decrease is too late for them.
Yet, -15% to -20% decreases in overdose would be unprecedented. To our knowledge, no public health intervention in the United States has ever achieved this benchmark. For example, NIDA spent $343.7 million (!) to show that it was possible to reduce overdoses by 9% in four states in one year. A reduction of this magnitude across the entire country translates to a very strong acting force. Something has changed. And that this is happening without central coordination is a big deal. It has major implications for the way we think about overdose prevention interventions.
And everybody we talked to had a different explanation why this could be happening. Most started off by saying any decrease was due to whatever they themselves were working on. Great that so many people find meaning in their work. But we have a job to do in establishing some truths and get the conversation started. And for the love of us all, do not ease up on whatever it is you are doing!
Motivating Example
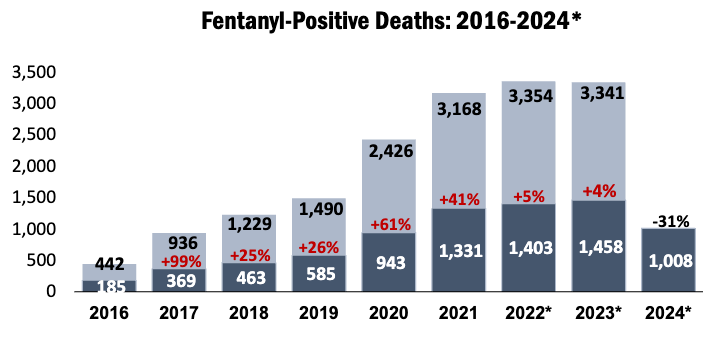
We set out on this investigation when we heard that fentanyl overdoses were down 31% from May of last year in North Carolina: 1,008 this year, compared to 1,458 the same time in 2023. We had also been hearing from community and harm reduction providers that things had "chilled out" a bit since the height of overdoses during the COVID years. Judging by these data, there are still twice as many overdoses as before the pandemic (585 in 2019). Dark blue is year-to-date for the same month the previous year, and light blue is the total for that year.
And then we looked up the national numbers and saw what appeared to be a -10% decline in overdose mortality. It was enough to dig deeper, but we were jaded.
Our Investigation
First, we looked at state health department dashboards nationwide, across a range of overdose metrics, to understand if state data were confirming the aggregate national trend. Do the pieces add up to the whole?
Second, we probed possible causes for a decline. We gathered a range of competing hypotheses: naloxone distribution, contaminants in the drug supply, border security, availability of drug treatment, and more. We looked at when the dips started, and what was happening around the same time. We examined patterns in geography.
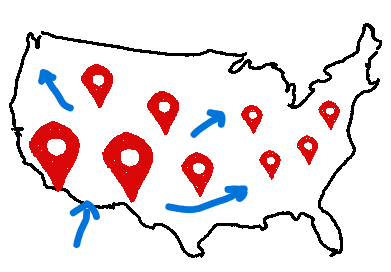
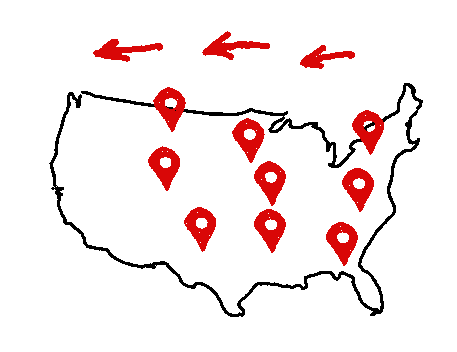
Spoiler: We concluded that non-fatal overdoses are down -15% to -20%. We also noticed a trend that the improvements spread across the continental from east-to-west.
Technical Matters
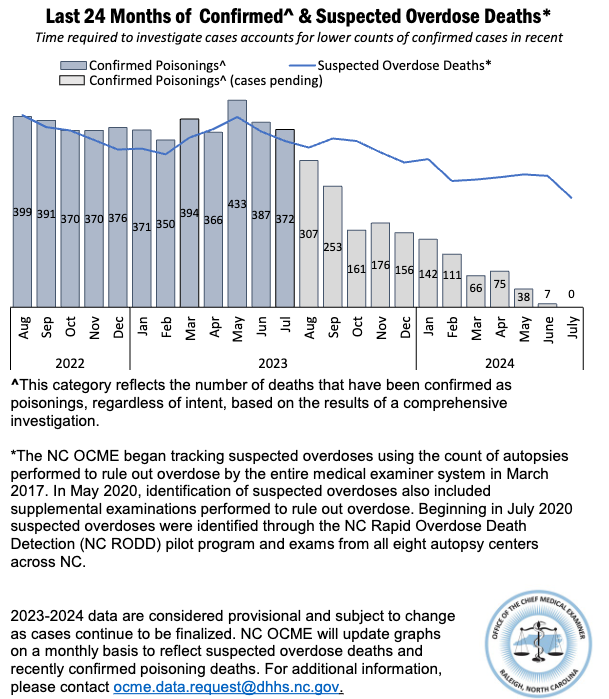
Why don't we have more timely data on overdose deaths? At the heart of the matter is the lag time between a death, its final cause being determined by autopsy, and those data getting reported to the national level. Crude overdose death counts are plagued by always appearing to go down in the past ~6-10 months because of the lag. We can see the lag in the North Carolina data, the light grey bars are pending (or "provisional") cases. Our medical examiners have an incredibly important and difficult job, and the division is chronically underfunded. 😦
There are sophisticated methods for accounting for this. Still, we are cautious when we see the Centers for Disease Control and Prevention (CDC) reporting a 10.0% decline in overdose deaths between April 2023 and April 2024. Also, sweater weather is around the corner and springtime statistics feel a bit stale.

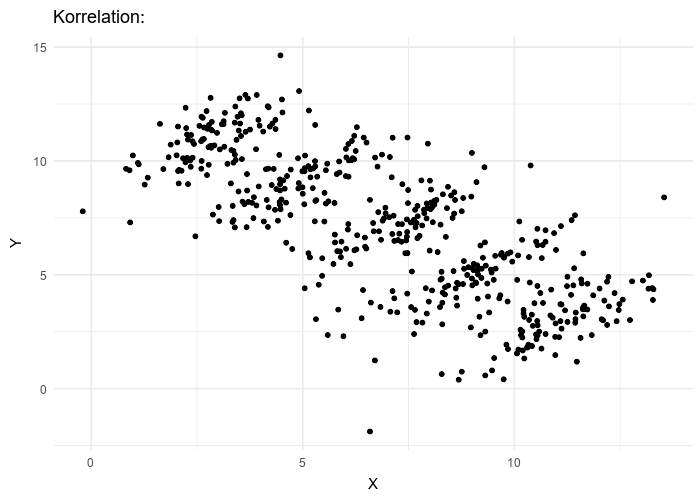
We think the term "CDC data" is a misnomer. It obfuscates the fact that these data are aggregated by CDC (by longstanding Congressional mandate), but they actually originate locally. So, if we are skeptical, we should go to source. Compared to national CDC-aggregated data, dashboards maintained by state health departments are more timely. They trade national representativeness for timeliness. Put another way, standardizing across a large nation requires data to be simplified. When simplified data are aggregated, strange things can happen. Simpson's Paradox describes a scenario where individual state numbers can all be going up, but the national aggregate will appear to be going down, because different states started at different baselines. Imagine each state as a different color in the hypothetical data below, and then being aggregated into the black dots nationally. The "korrelation" numbers above are R-squared values, all of which are statistically valid.
This mind-bending scenario occurs when states with lower overdose rate influence the national average more heavily, hiding the increases happening in smaller individual states.
So, we need to first see if the national trend holds at the state level. And if there are legitimate declines, then we want to know why.
Backstory
Overdoses had been holding steady or just starting to dip before the onset of COVID restrictions in 2020. Immediately after things shut down, overdoses went up. Overdose indicators at the county and state level document the early COVID-era increase very clearly, but the national mortality numbers show a less prominent pattern. Not surprisingly, as medical examiners dealt with a major increase in the absolute numbers of deaths, overdose fatalities during 2020-21 were undercounted. Here's the takeaway: National OD mortality numbers can be buffeted by other societal forces. So, it is worth digging deeper into any apparent national change in overdose rates before we draw conclusions.
Our Methods
We investigated overdose metrics on state dashboards using this list maintained by the Carolina Center for Health Informatics at the University of North Carolina. (We were not involved in the compilation.)
Metrics
We looked at overdose deaths, hospital emergency department (ED) visits, and calls to emergency medical services (EMS; aka ambulance runs).
The generation of overdose death data is intentionally deliberative. It takes a lot of time because each case is reviewed by multiple medical experts, supported by chemical and other forensic analysis.
In contrast, the sources we are using for hospital emergency data are nimble, and can be aggregated to state level within hours. However, the data are thin. It is literally one line of information (imagine one row on a spreadsheet with a dozen columns for date, age, gender, and “chief complaint”). It is that last field that differentiates a car crash from an overdose. It’s based on quick clinical observation, often by nurses. Sometimes the data row gets updated after lab tests. And then it gets assigned an alphanumeric code that is uniform across hospitals. This early warning system is also used for infectious disease outbreaks, bioterrorism events, extreme heat/cold related issues, etc.
Finally, EMS data are published even faster. These data can be noisy. But they offer a handy national snapshot. These are usually non-fatal overdoses.
These three data systems are independent. Taken together, if a consistent trend appears in all three, we would have a lot more confidence that declines in overdose are real.
If emergency care goes up and overdose deaths go down, we could interpret that discordance as more people getting care for a potentially life-threatening condition successfully. On the other hand, if emergency care and deaths go down at the same time, they are likely measuring an actual change in the number of overdoses independently.
Definitions
"Overdose" definitions can vary. For example, are suicides included? How do you count overdoses with no specific listed substance? At the end of the day, we chose to let each state define the overdose metric that is of local importance. While this may not be standardized, there are a finite set of ways of counting. As long as the ICD codes that were used are explicit, we chose to proceed with the metric(s) that each state has chosen to report. In this way we are respecting local autonomy.
To state the obvious – the overdose death spikes that accelerated during COVID restrictions are due almost exclusively to non-pharmaceutical fentanyl, in powder and fake pill forms.
Comparison time window
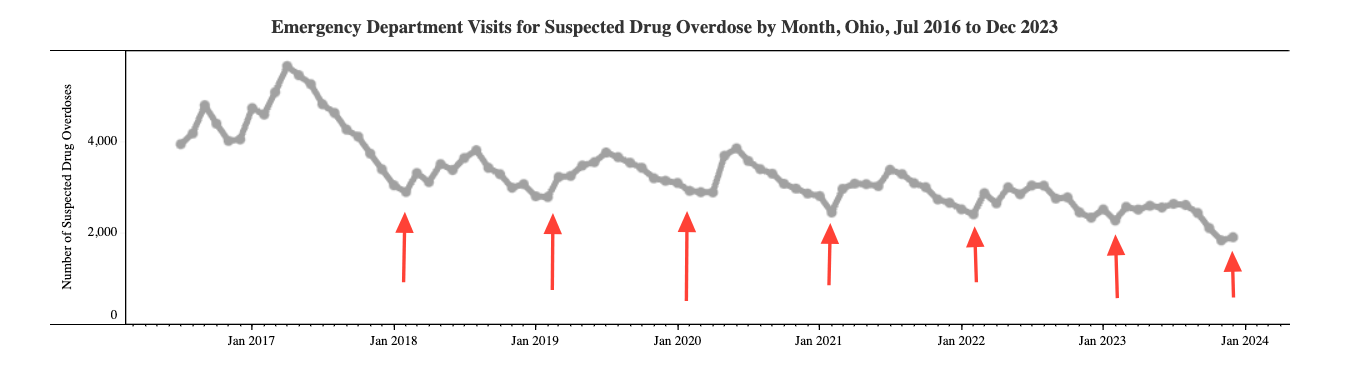
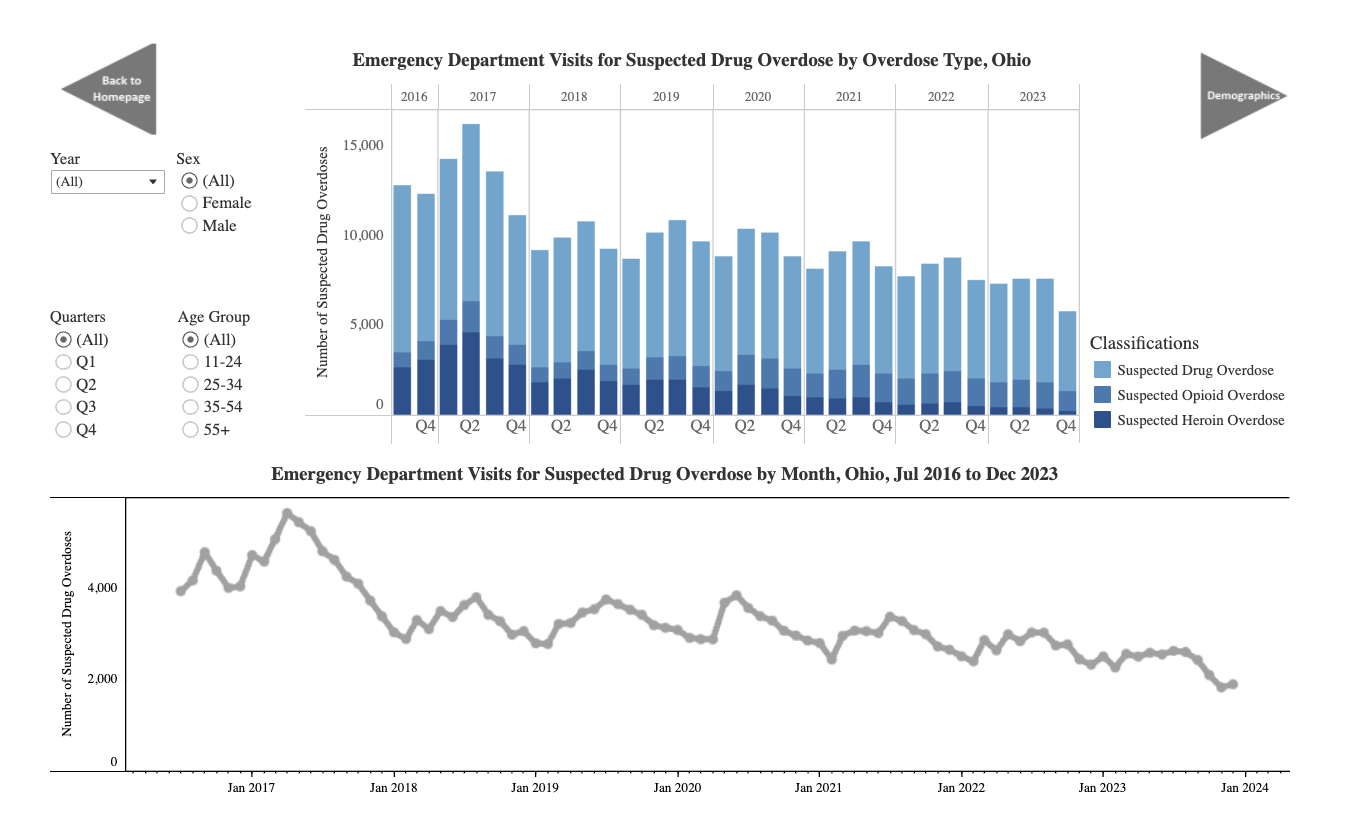
A fundamental question is what time frame to to compare. Overdose ED visits are influenced by factors like ambient temperature and time spent outdoors, so in Delaware OD visits increase in April-May, while in Arizona they decrease around the same time as people stay indoors out of desert heat. In Rhode Island cold weather increased overdose. In British Columbia hot weather increased overdose. Collectively we call this "seasonality" and you can see the cyclical pattern in Ohio, where overdose counts are lowest in Jan-Feb. (February also has fewer days.)
Regardless of the cause, a common way increase validity is to compare to the same time the previous year. We chose to compare the same month in 2024 to the same month in 2023 (i.e. year-over-year monthly change).
Data Considerations
At the Opioid Data Lab, our scientists have been at the forefront of addressing the methodological nuance of measuring overdose. We are constructively critical of the whole enterprise, and have offered new solutions to improve data quality. At the links below we list some caveats.


1. Are Overdoses Down?
OD mortality, hospital emergency visits, ambulance runs
Overdose Mortality
CDC adjusts for the reporting lag with a "predicted" rate of overdose nationally. These models don't predict the future. Instead they “predict” what happened about 6 months ago, the general average lag time for autopsy investigations. As of September 2024 the predictions go through April. The dots and line are on top of each other, meaning the prediction and actual performs very well over time.
The overdose curve bends lower starting in 3Q2023.
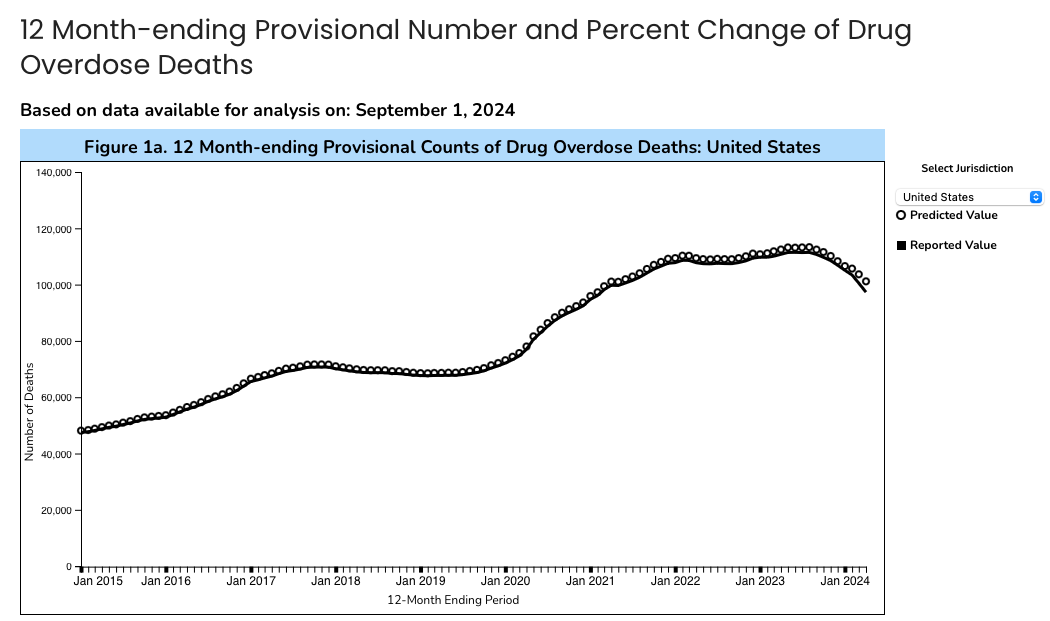
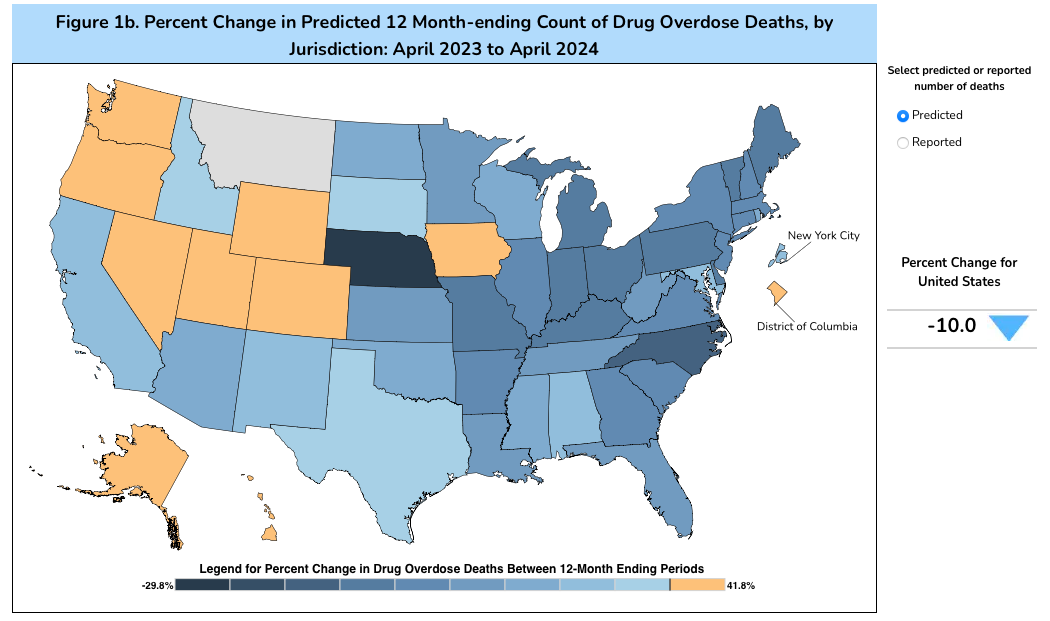
With the adjustment for reporting delays, currently, the US is reported to be at a -10.0% year-over-year decrease in overdose deaths, through April 2024. (Without adjustment, the crude rate is -12.2%.) Note that these are changes in the absolute number of deaths in each state. But, this could also be explained by Simpson's Paradox: The national aggregate death count driven down by more substantial decreases in larger population states, while some states are going up. We should keep our skepticism.
Hospital Emergency Visits
So let's look at an independent data source. CDC also aggregates overdose-related visits to emergency departments in hospitals. This is a completely different system, maintained by a different part of CDC. Aggregating the hospital data is a totally different process from the mortality data, having worked to build these system. Again, these data originate locally. In this case, they are from hospitals, many of them privately owned. Note that these are changes in rates per total ED visits, which is another standard way to adjust for fluctuations in the total number of ED visits. (Staffing, ED crowding, and other factors can influence the overall number of hospital visits.)
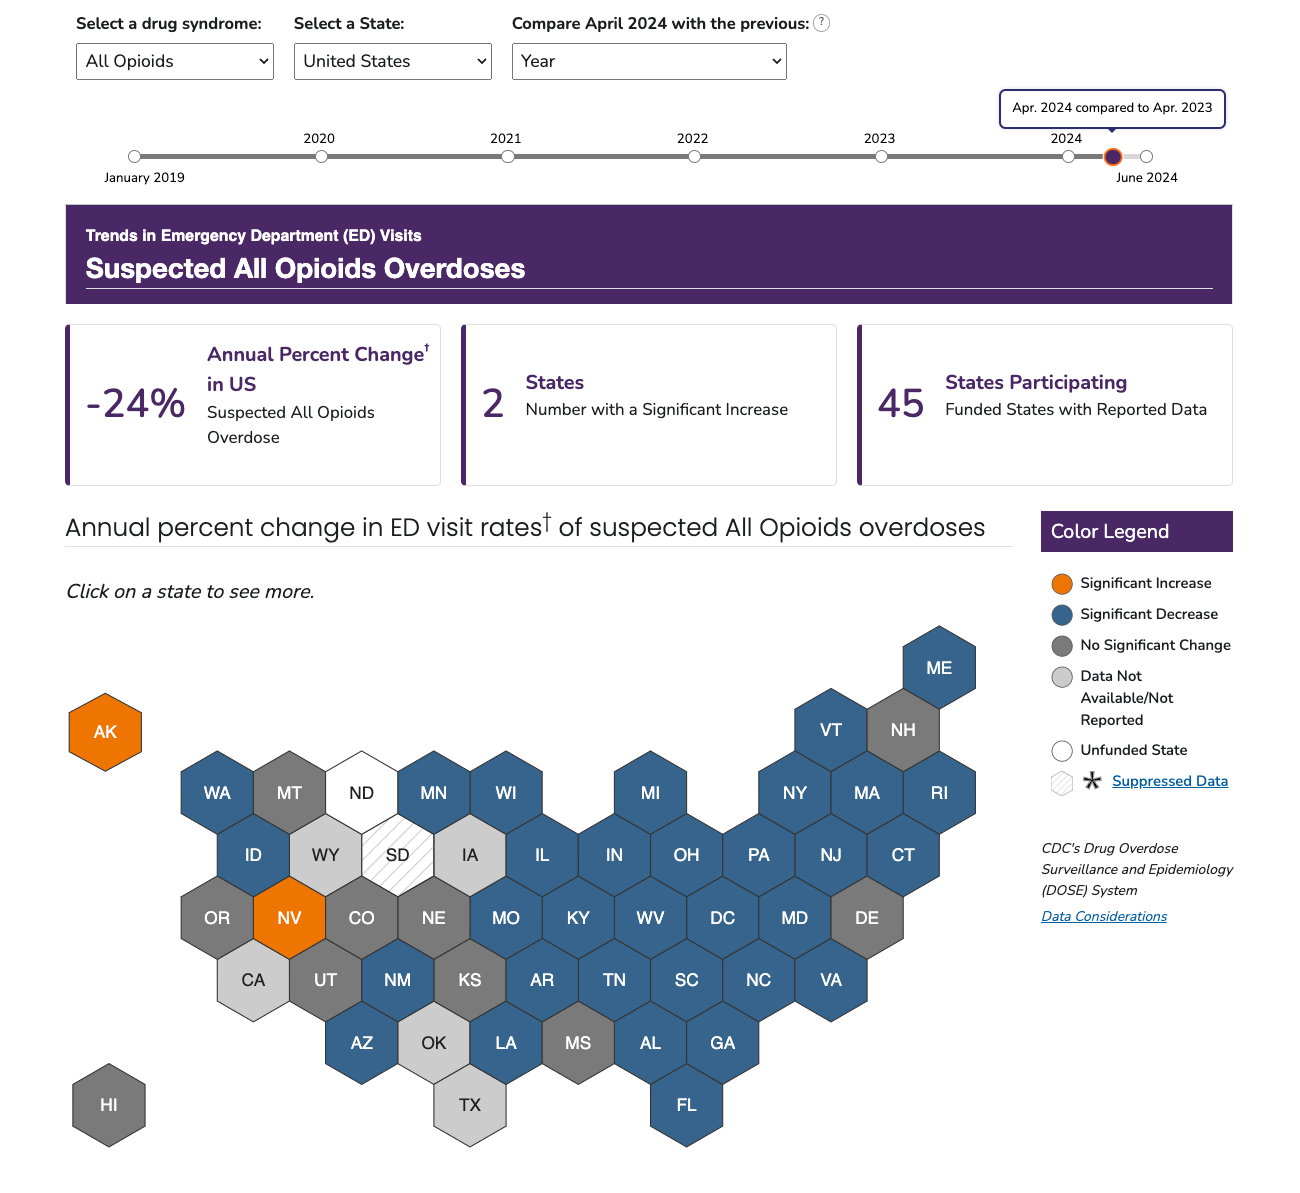
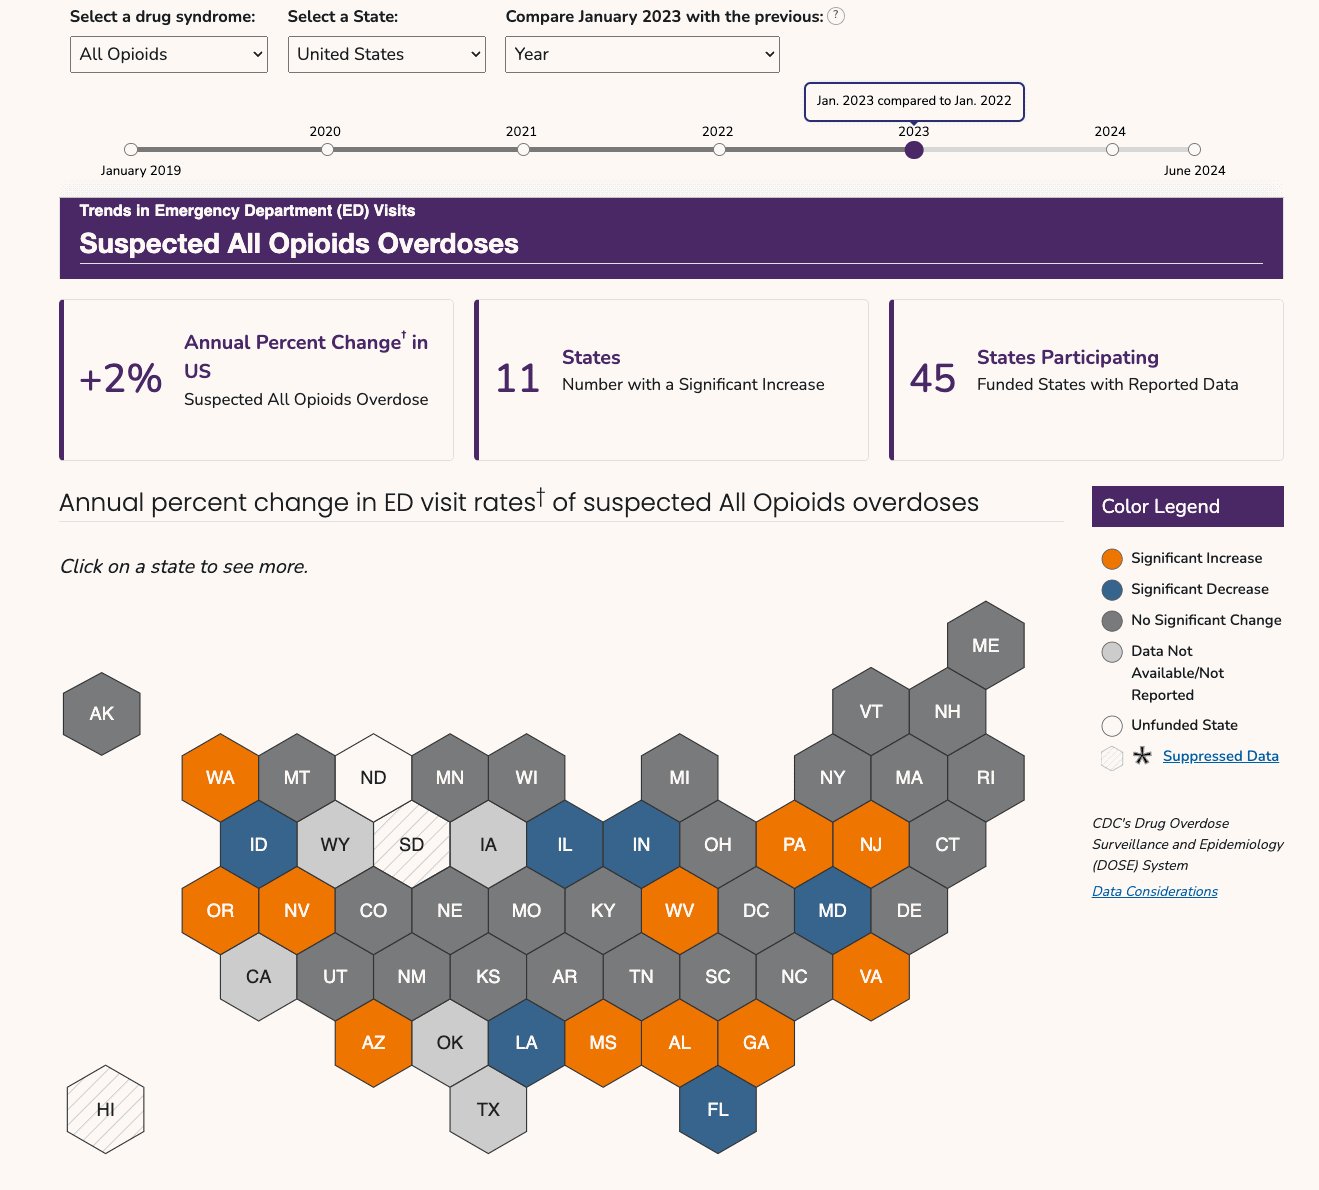
To align with the mortality map above, we can compare ED visits in 2023 vs. 2024, showing an unprecedented 24% decline across Aprils.
East to West
Moreover the general spread of states matches mortality. Declines in both mortality and ED visits in the Northeast, then the South and Midwest. Nevada and Alaska are higher on both. Washington, Hawaii, Nebraska, Oregon, and New Hampshire are discordant, but within expected noisiness. (Unfortunately no data are available from Wyoming and Iowa, of the few states where mortality was higher than the the month in the year previous.) The association isn't perfect, but the overall pattern holds.
Each state is a hexagon. Orange represents the rate of overdose hospital emergency visits being higher than the same month the previous year. Dark gray is no change. And blue is a decrease compared to the same month in the year previous that is "statistically significant."
From Orange to Blue
We created the animated GIF below to show the change over a longer time span, and you can modify the visualization here. On average over the first nine months of calendar year 2024, opioid overdose-related visits to hospital EDs seem to be down, around -15% to -20%. Notice the map going from orange to blue. And notice the pattern is that the declines started in the east and migrated to the west.
The available data go through June 2024, which shows a 13% decline in hospital ED visits for opioid overdose from the previous June. (Discrepancy is within the known variability in this data system, and statistical moving averages, smoothers, etc. that can be applied if we wanted to go there.)
Here's the takeaway: ED visits look to be down about 15-20% since last year.
Put another way, the more meticulous final OD mortality data will give us a magnitude of effect that will serve as the metric of record. In the meantime, the fast hospital data give us confidence we are on the right track.
EMS 911 Calls
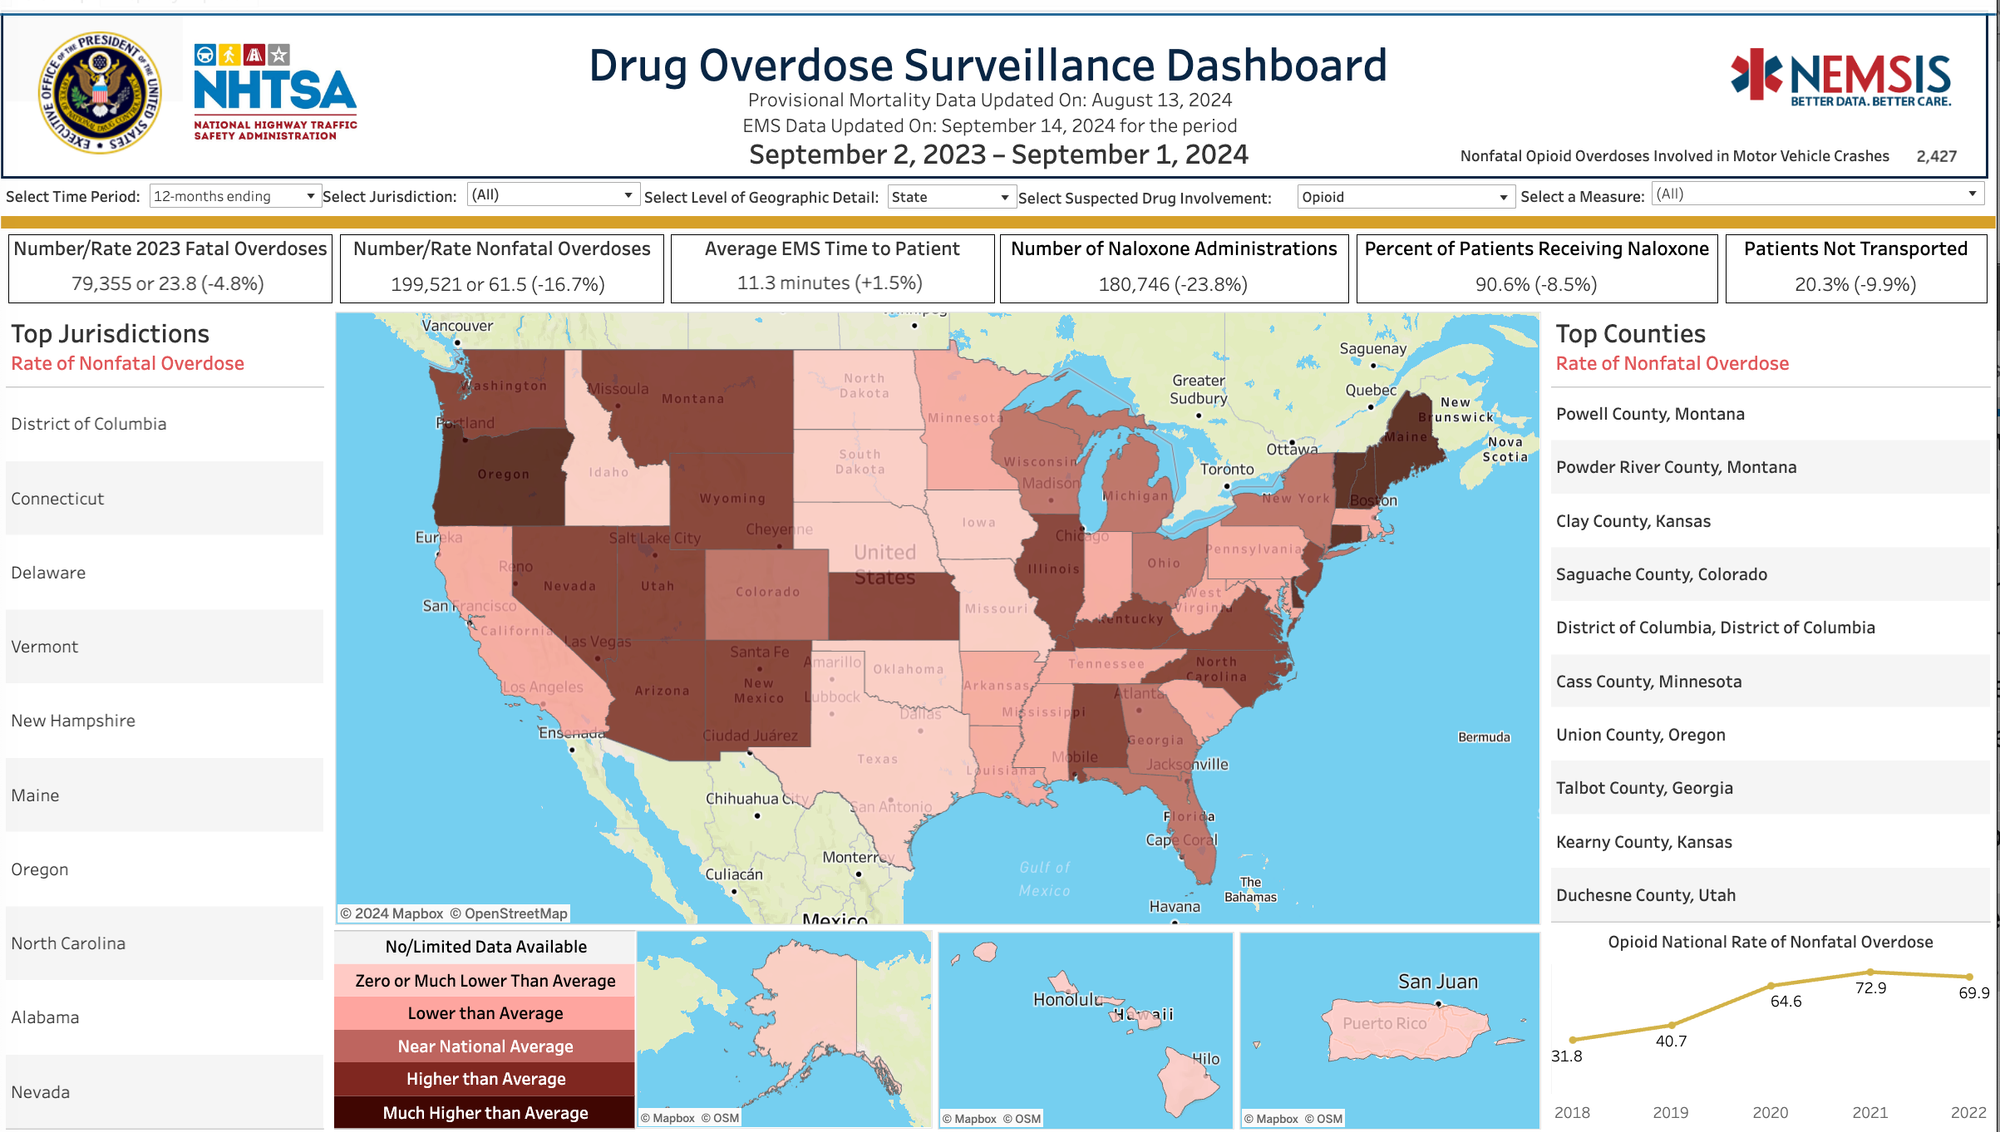
Now we turn to another completely independent system. EMS responses (e.g., from 911 calls) are recorded in the National Emergency Medical Services Information System (NEMSIS). This is the fastest-available data nationally. Overdose data are compiled into a dashboard by the National Highway Traffic Safety Administration.
First responders are reporting that non-fatal opioid overdoses are down 16.7% in September 2024 compared to September 2023.
Other National Data Sources Considered
We also checked in on: NDEWS has no public trend data for their real-time 911 calls, and ODMap has weekly data from police and EMS but prohibit public access. NMURx 2024Q1 data were available (slide 18) and was the only data source that showed any increase in illicit fentanyl use this calendar year. Data from the new DAWN ED system are limited to HHS federal agencies only.
In conversations on September 16, 2024 at the DAWN Engage convening in Silver Spring, Maryland (in which we participated), data scientists at DAWN said they had received the data but not yet completed the time trend analysis through July/August 2024. We will update this page when we hear from them. Their initial take was that some EDs may be testing more regularly for fentanyl in 2024 than in previous years, so any actual decrease in time trend may appear attenuated.
Looking to the States
Okay, so the national numbers across three independent sources are in agreement: A 10-20% decline in fatal and non-fatal overdoses compared to last year.
We’ve been hearing stories from all over: Maine, Missouri, Ohio, North Carolina, Kansas, New Mexico, Indiana, and beyond. The message is consistent: Local overdose death numbers from fentanyl seem to be dropping. Here is the Governor of Maine:
Overall, the U.S. CDC found that drug overdose deaths in the United States decreased by three percent in 2023, the first annual decrease since 2018. Drug overdose deaths in Maine decreased by nearly 16 percent over this same period; only Kansas, Nebraska, and Indiana also saw decreases of 15 percent or more, according to the report from the U.S. CDC’s National Center for Health Statistics. Source
To be clear, this is not happening everywhere, and locally, things may fluctuate from month to month. Also, state or national numbers will feel wrong when there's a run of overdoses in a neighborhood, and we find ourselves at yet another funeral. Acknowledging all that, let's see what the state data can tell us.
Data below from 16 states: North Carolina, Kentucky, Vermont, Maine, Arizona, Ohio, Florida, Connecticut, Oregon, Pennsylvania, Alaska, Rhode Island, Washington, Georgia, Illinois, and Maryland. Most other public state dashboards had not been updated since 2022 and some are stuck in 2020 or 2021. 🙄
The trend is clear. Something changed in late 2023 and into Spring 2024 to bring overdoses down. Change in magnitude is roughly in the -10 to -20% range.
North Carolina
Pulling up the North Carolina Statewide Overdose Surveillance Report from July 2024 (which, BTW, you should sign up to receive at SubstanceUseData@dhhs.nc.gov), we see:
This view is striking because, while unacceptably way too many people we love are dying, we also see that the rate of increase in fentanyl OD deaths stalled in 2022 and 2023, after 25% to 61% annual increases the five years before. And then 2024 is the dramatic plunge.
We talked to our colleagues at the NC DHHS who published the graph above. We asked if there were any data processing artifacts that might artificially deflate the trend. And we asked if they were noticing any patterns with sex, age, or race. Here's what they told us:
- The 2023 death certificate data are still incomplete, especially Q4.
- There were no notable differences in the percent breakdowns by sex.
- There were small increases in the 35-44 and 65+ age brackets and a small decrease among 45-54-year-olds. Other age groups were the same year over year.
- The percent-of-total by race/ethnicity showed decreases for non-Hispanic whites and non-Hispanic American Indians. Percent-of-total increased for non-Hispanic Blacks and Hispanics.
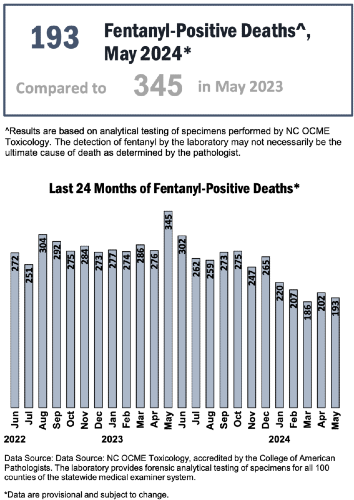
They went to the sources behind the published numbers and looked into the 2024 cases that are still under investigation. The toxicology findings are available for these, so fentanyl-positivity can give us a sense of what's happening, since nearly all of these eventually get adjudicated to be overdose deaths.
- No notable differences in sex.
- Small increases in 2023 and 2024 among 35-44-year-olds.
- Larger percent of fentanyl-positive deaths are among Black individuals, smaller percentage are white. This has been consistent since 2021.
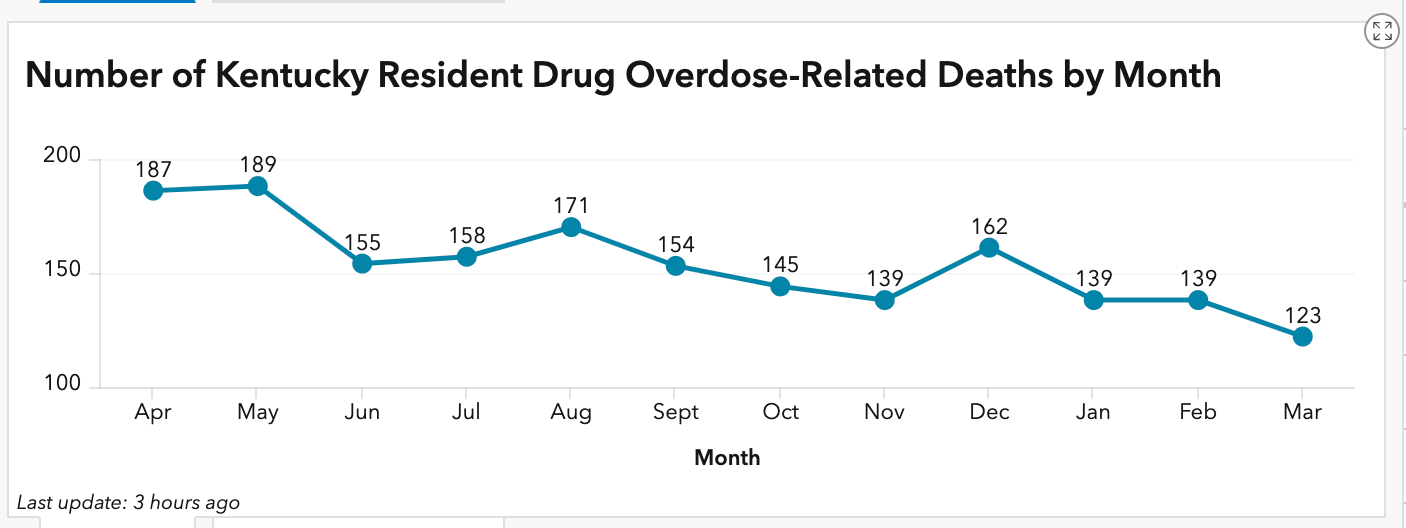
Kentucky
Kentucky has some of the cleanest and fastest overdose death data in the country. So let's start there. (We work closely with our colleagues at U of KY where they created the system.) Deaths from all drug-related overdoses were down from 187 to 123 April 2023 to March 2024 = -34.2% drop in mortality.
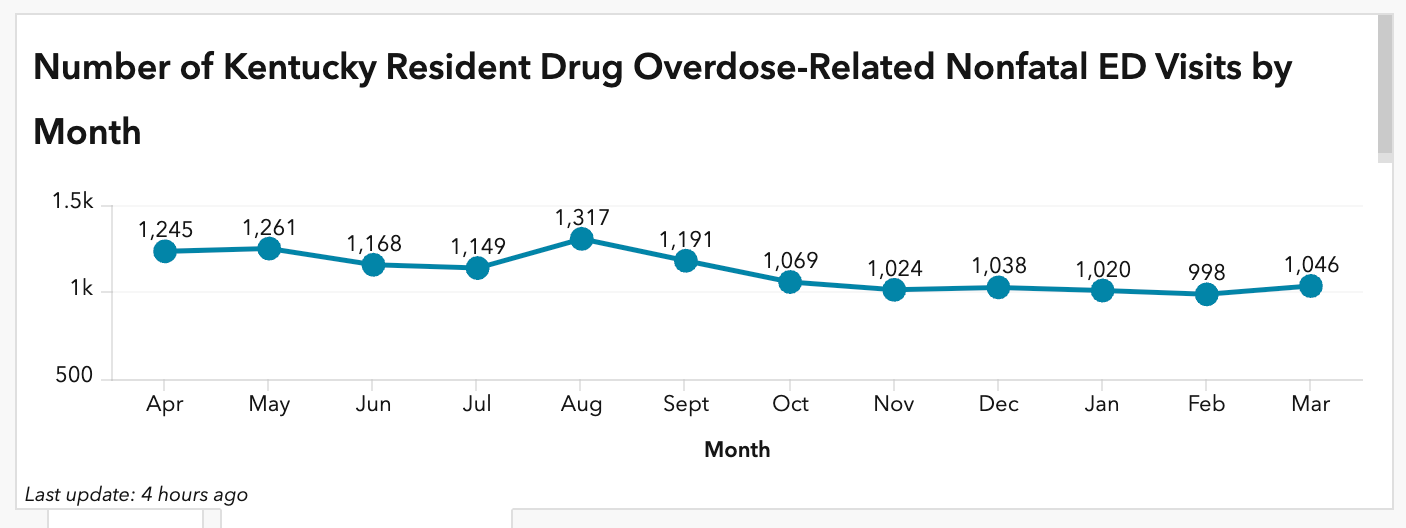
And here is non-fatal ED visits for all drug overdoses. April 2023: 1,245 versus March 1,046 = -16.0%. For most other states we will see that OD mortality is smaller magnitude than ED visits, so this is reading in KY is interesting.
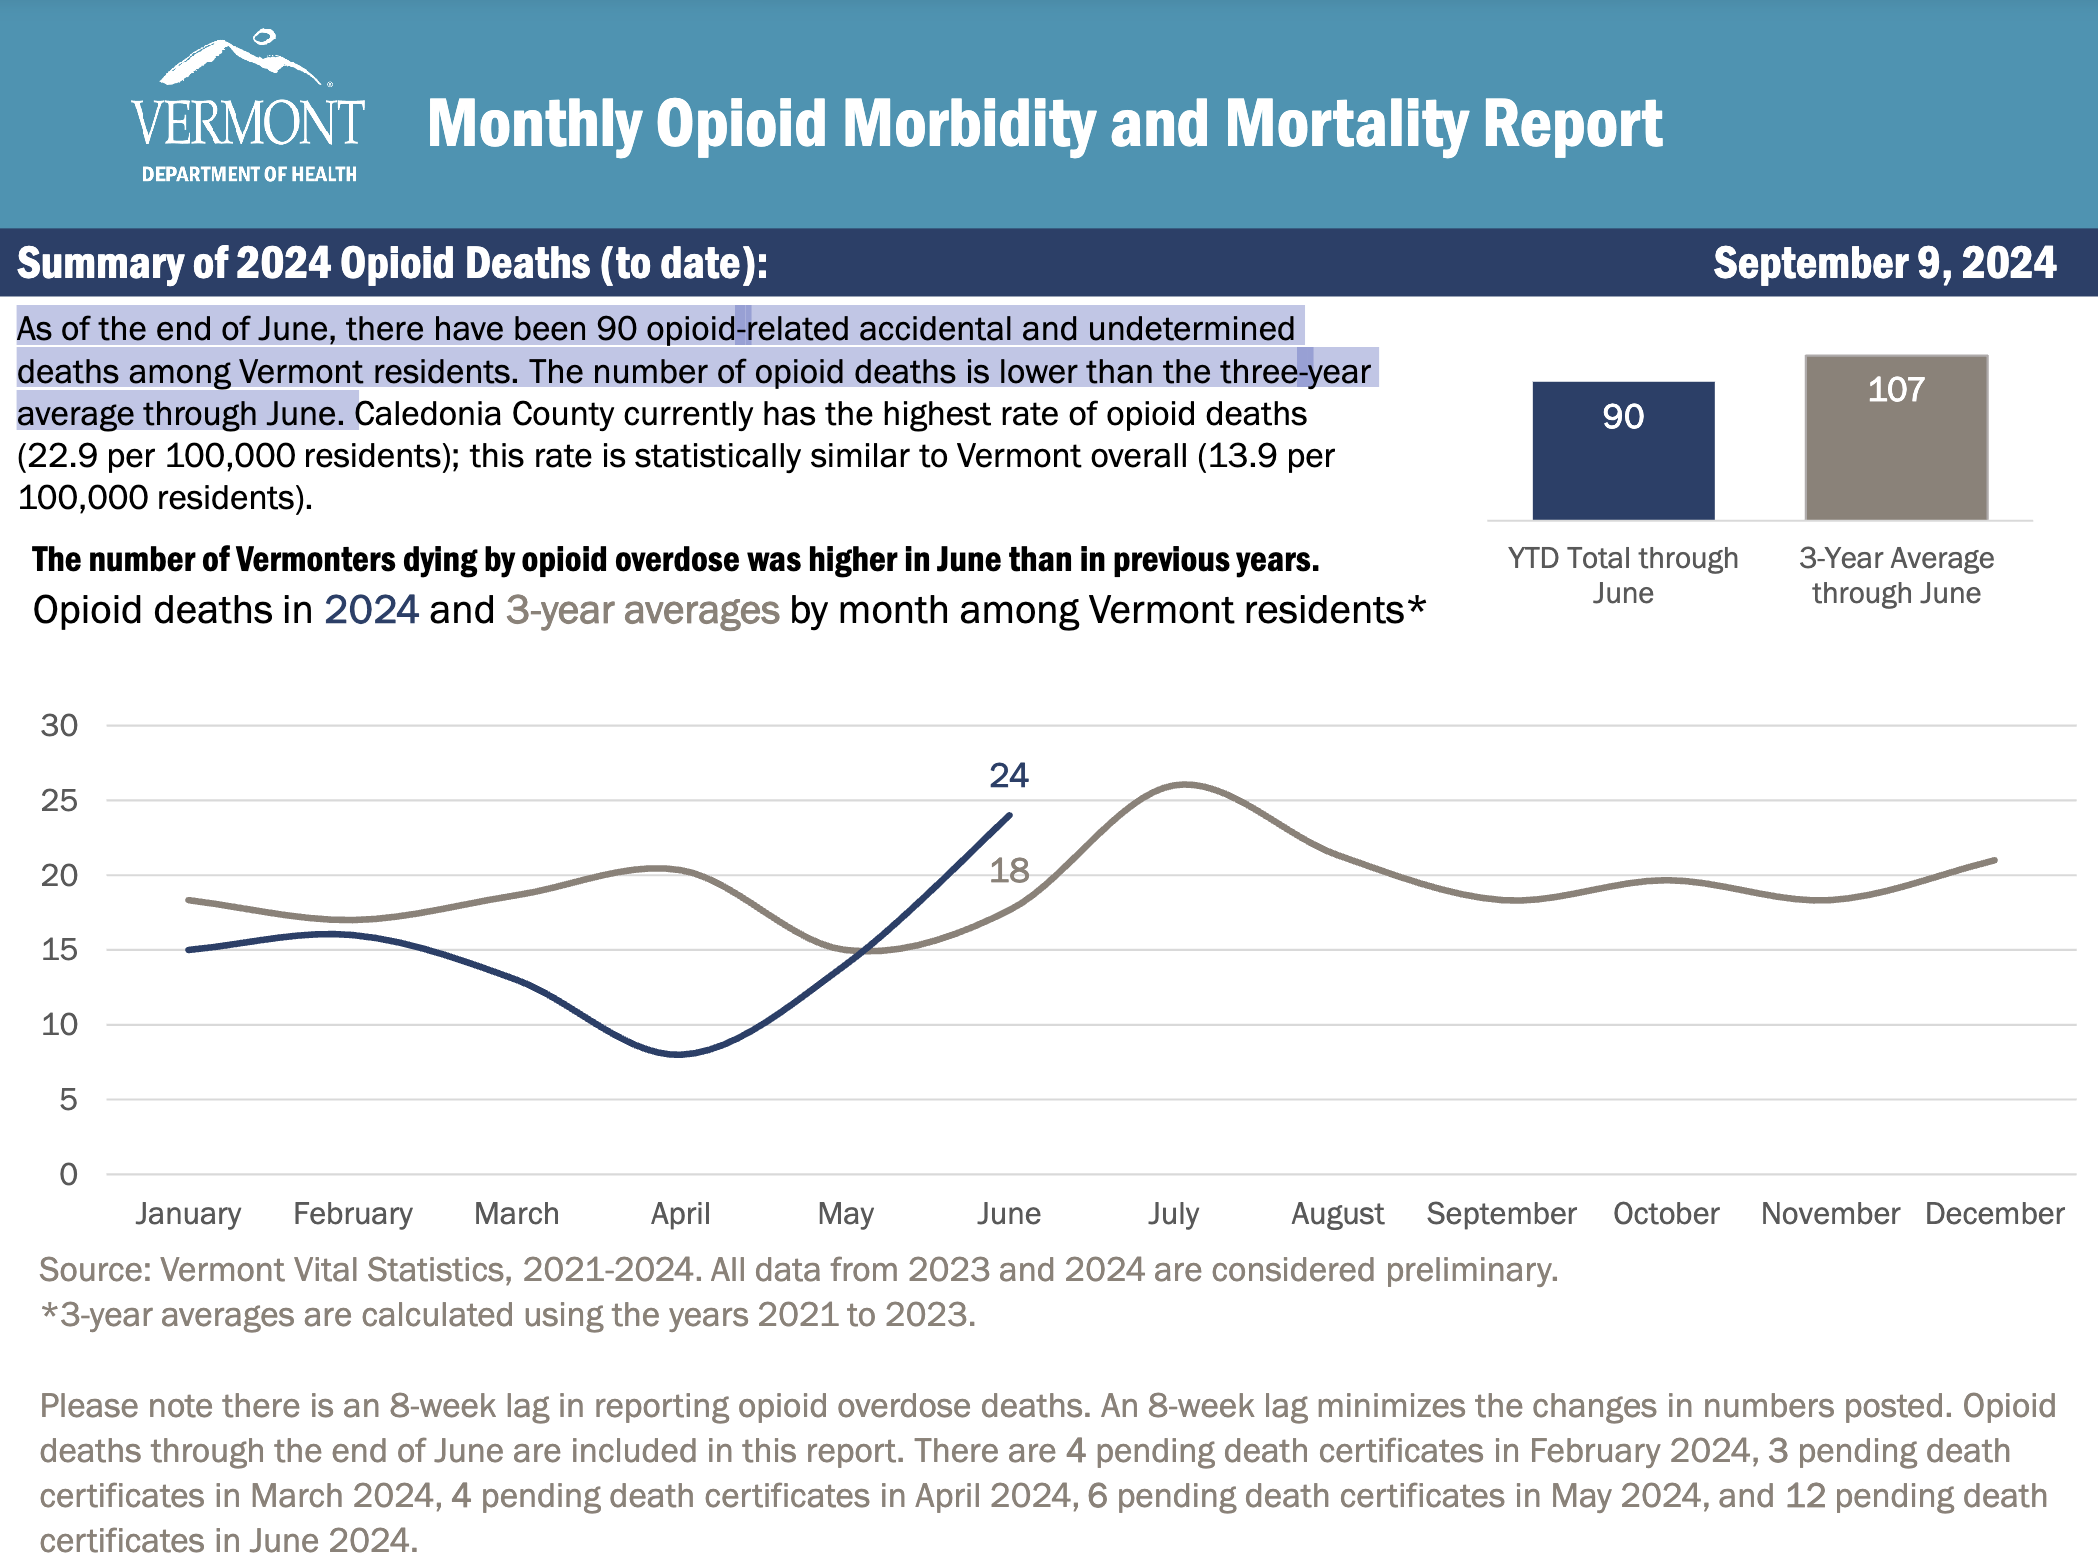
Vermont
Vermont is also another state with very fast overdose death reporting. The 3-year average was 107 through June (2021-2023), but in in 2024 it was 90, so down -15.9%.
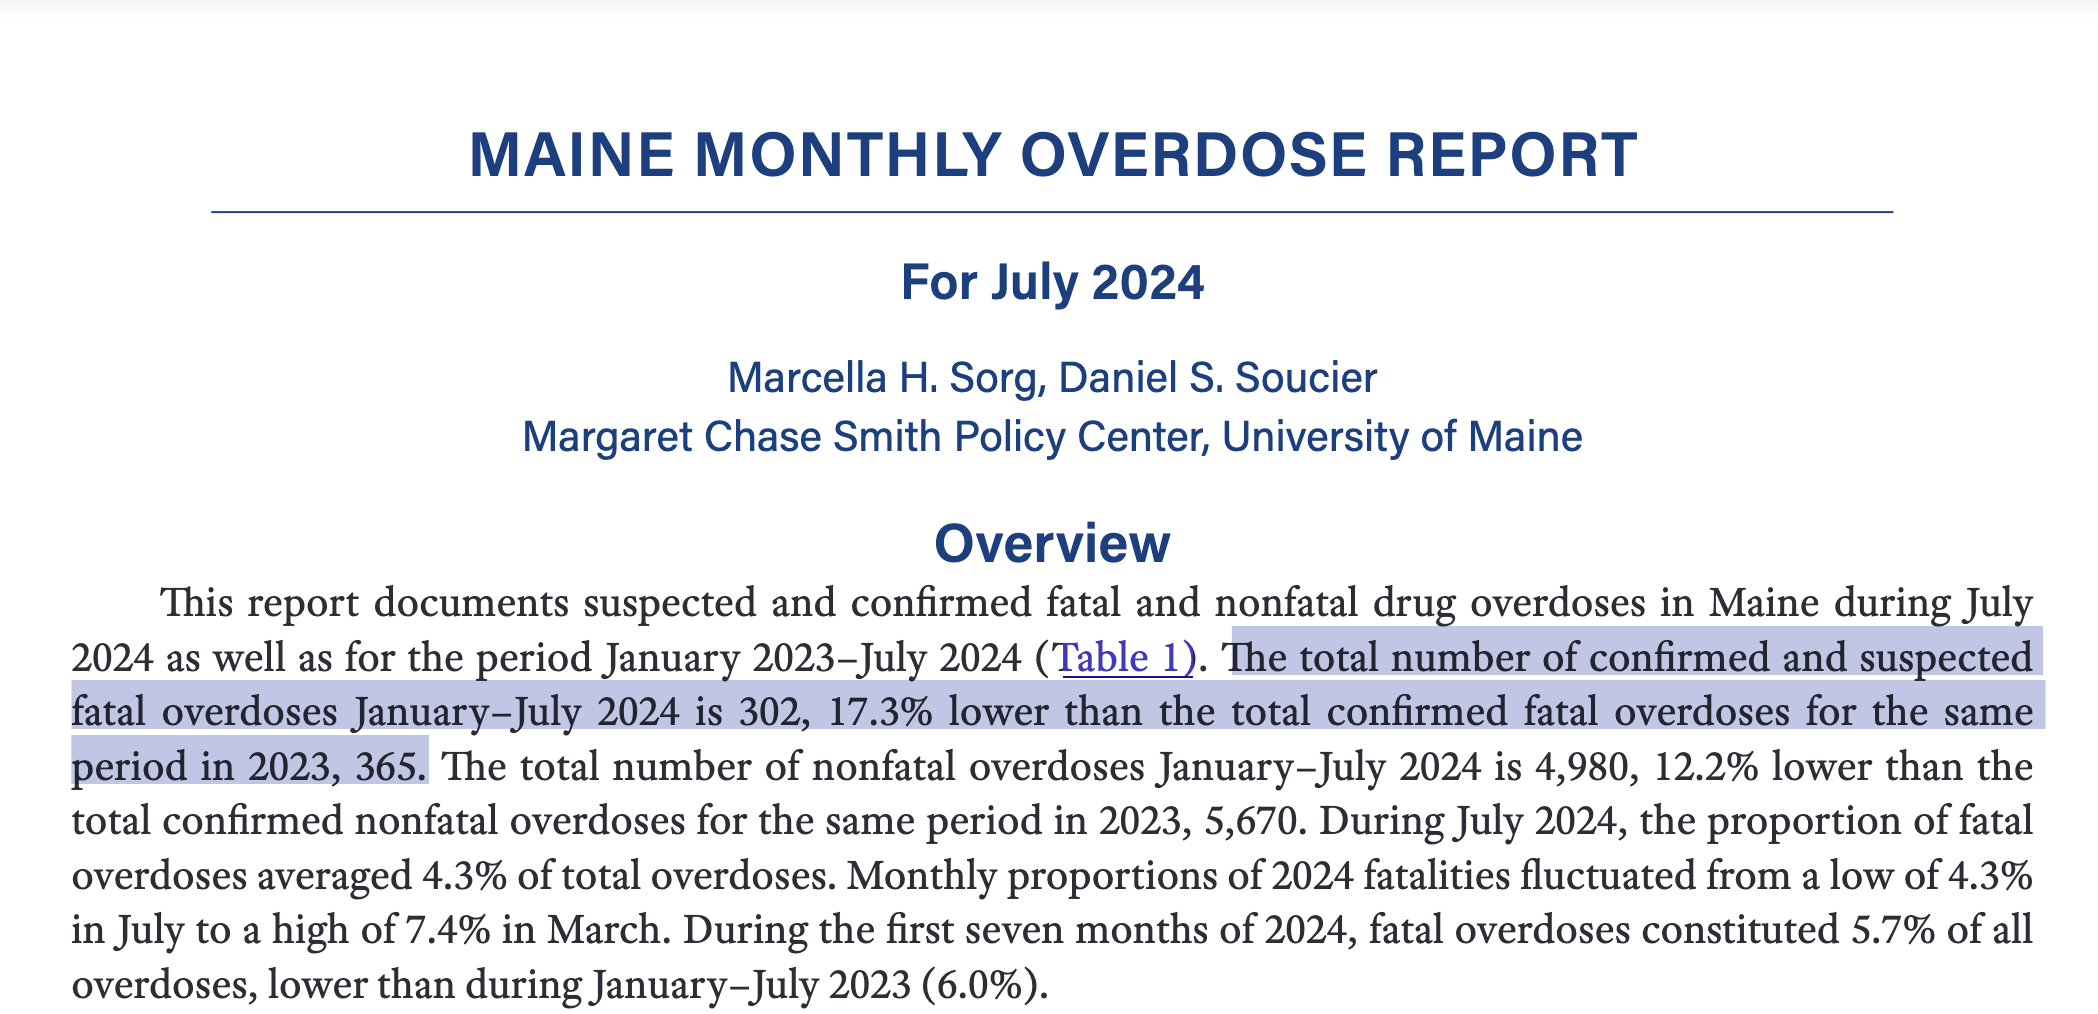
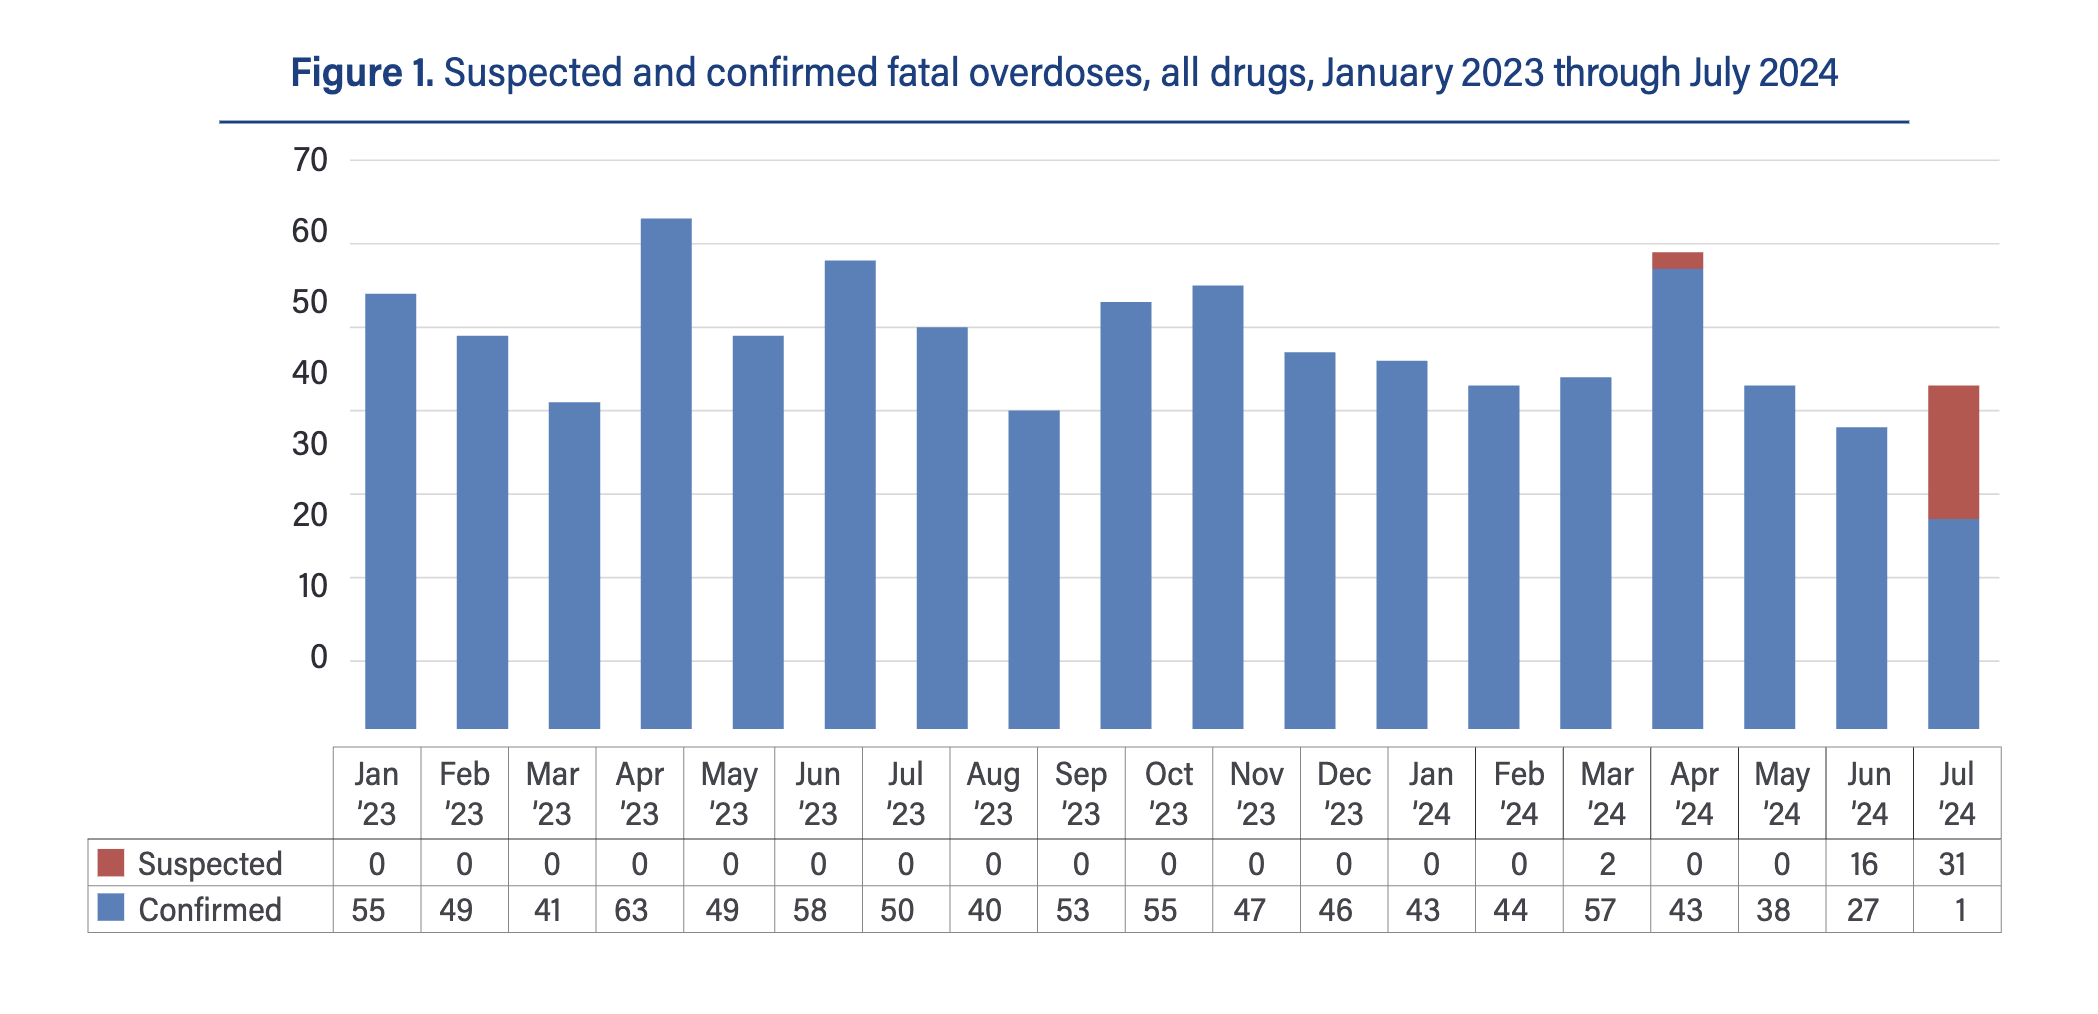
Maine
The great state of Maine is another heavyweight in reporting of overdose deaths in terms of speed and accuracy. Marcie Sorg has been running this program for 2 decades and the data are consistent. We'll just paste what she says:
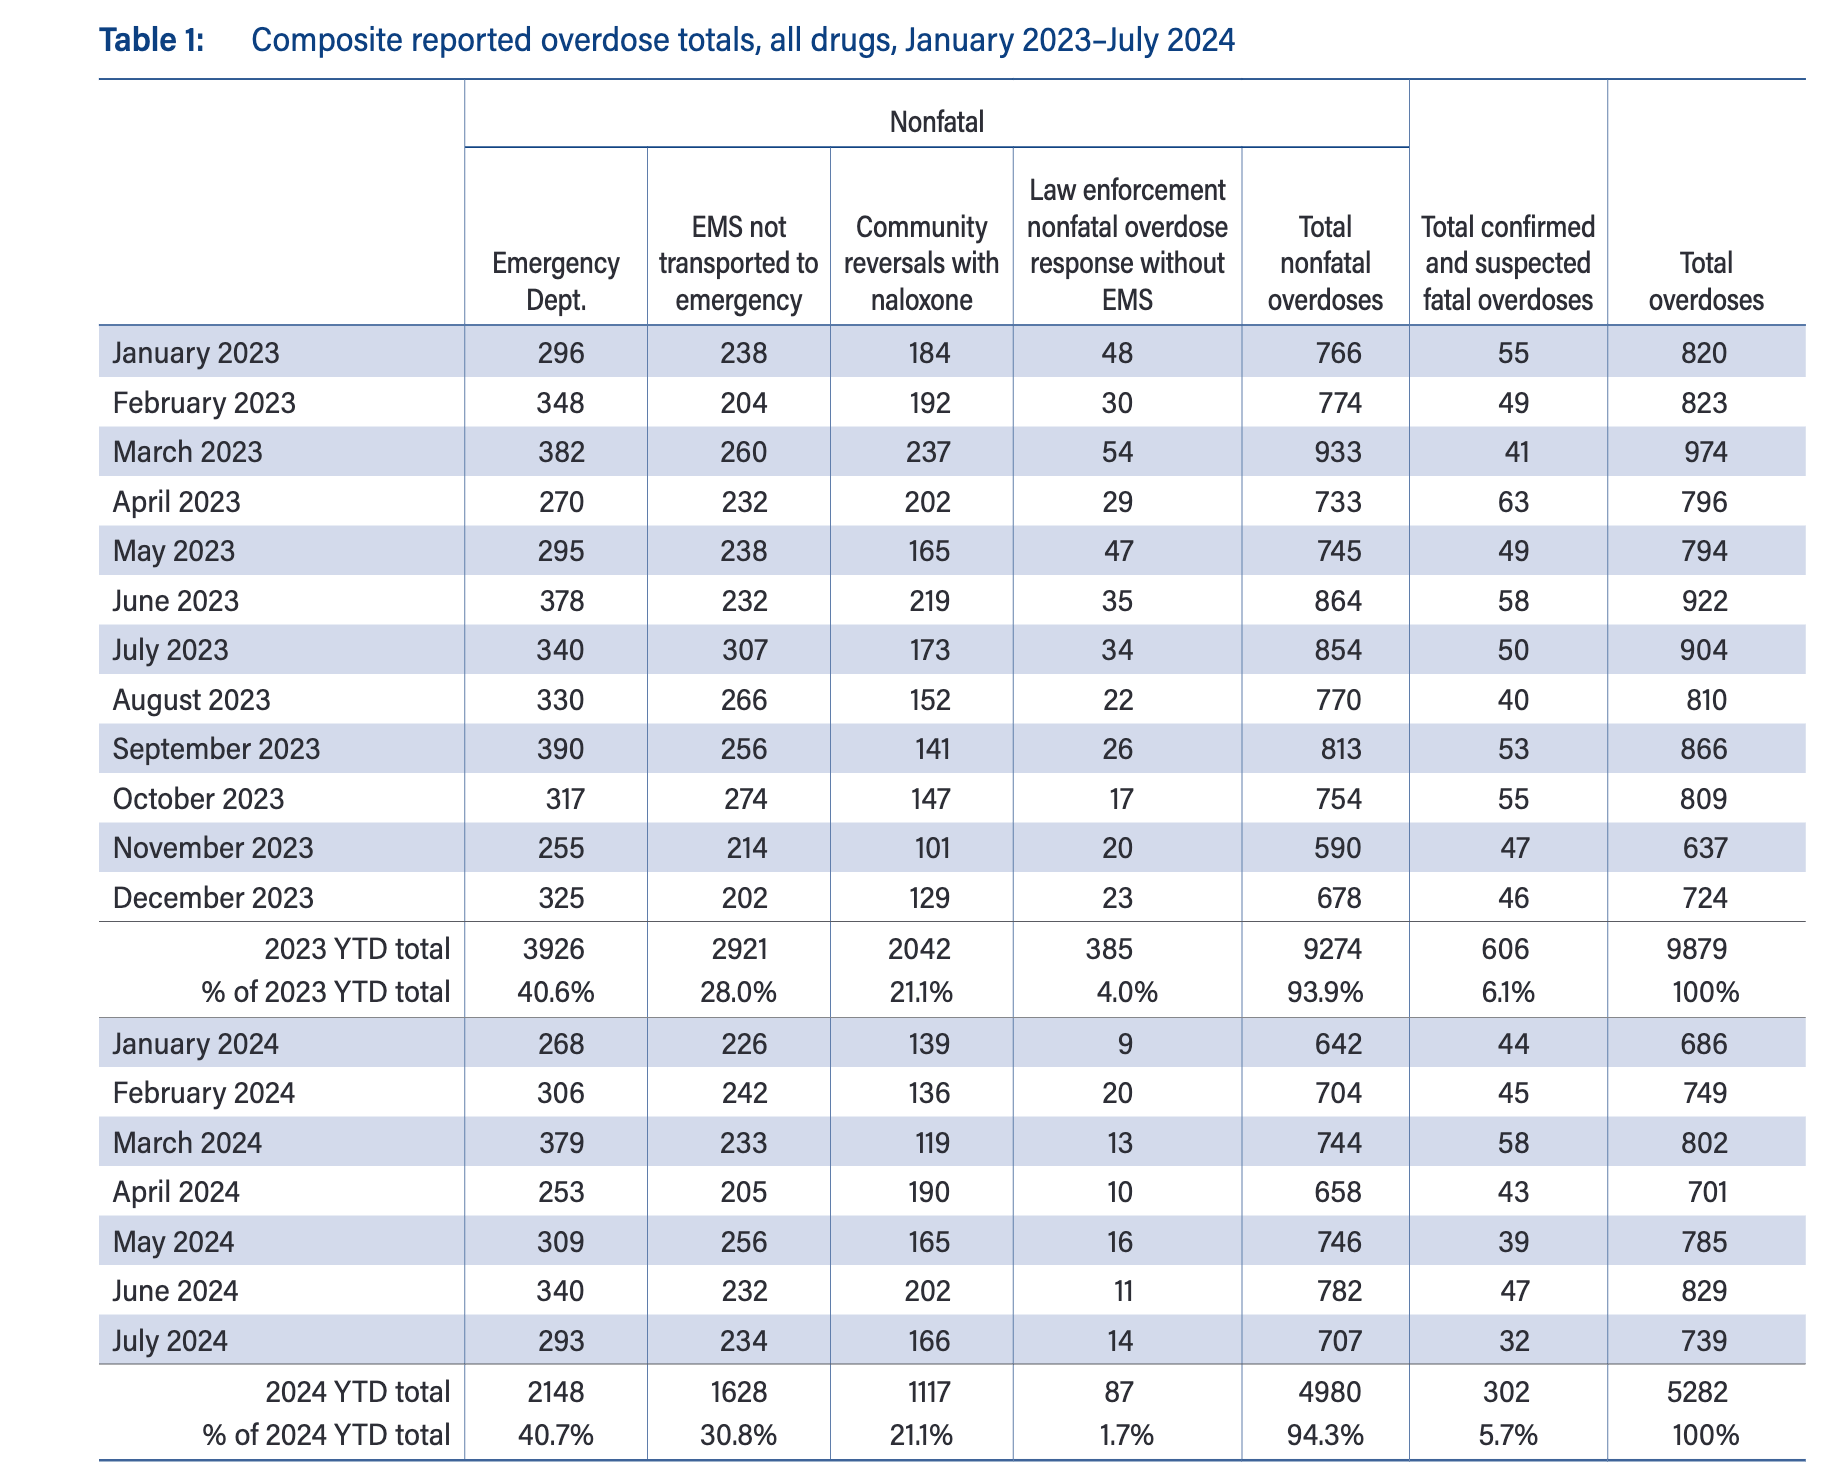
"The total number of confirmed and suspected fatal overdoses January–July 2024 is 302, 17.3% lower than the total confirmed fatal overdoses for the same
period in 2023, 365. The total number of nonfatal overdoses January–July 2024 is 4,980, 12.2% lower than the total confirmed nonfatal overdoses for the same period in 2023, 5,670.
So we can compared to other states, looking at ED visits, year-over-year for the most recent month available, we get:
July 2023 340
July 2024: 293
That is a -13.8% drop in ED visits, comparable again to fatalities.
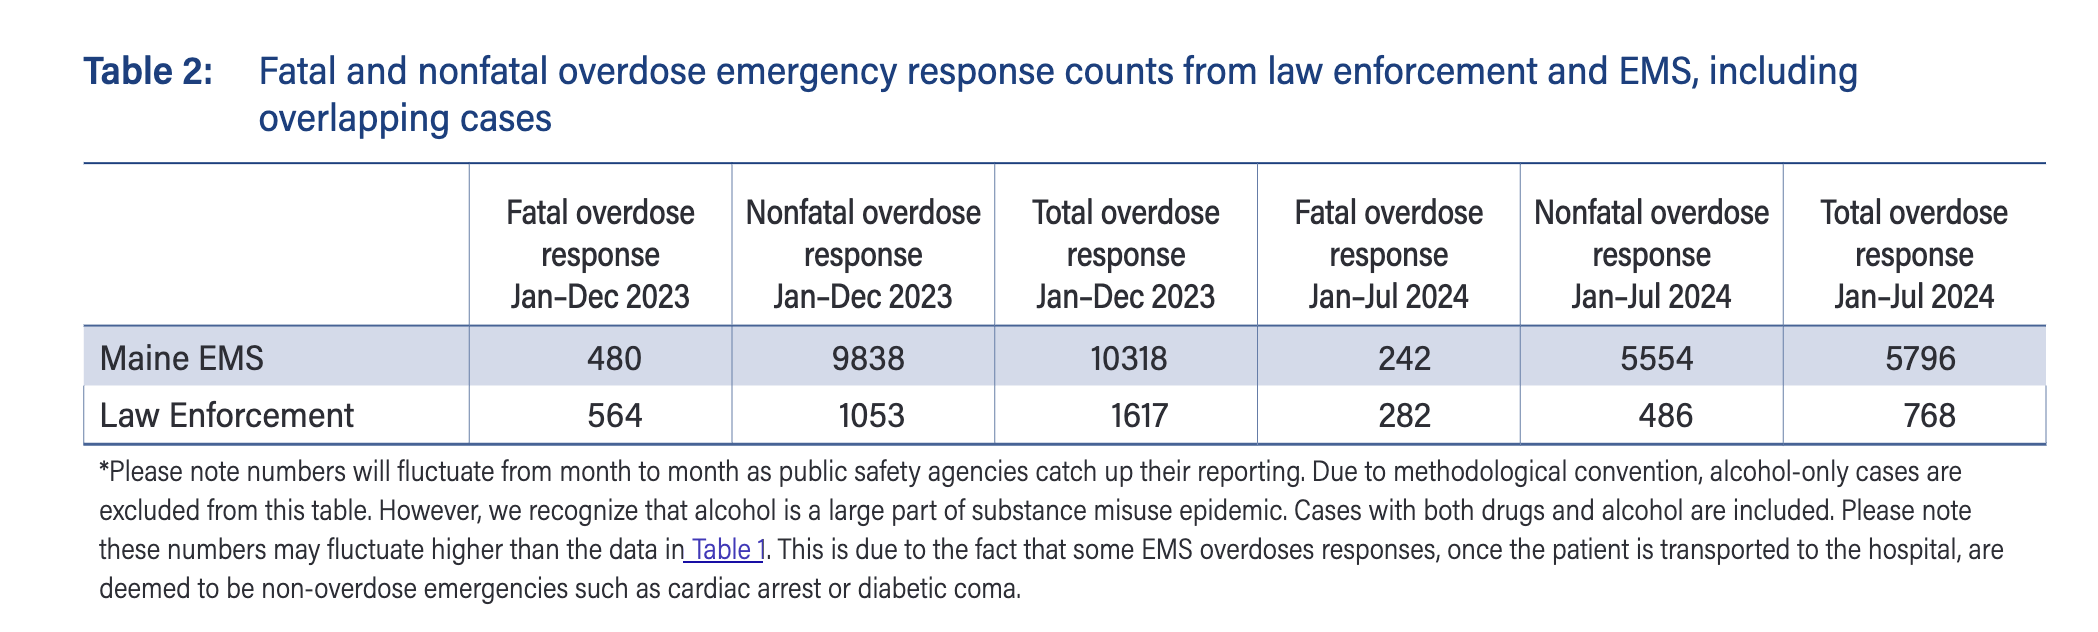
They also provide EMS and police responses, which is one of the few states where we can probe differences between these two types of uniformed fist responders.
And, then there is the super-composite, which includes fatal ODs, ED non-fatal, EMS not transported, community reversals, and law enforcement reversals. Got to love a small population state with dedicated data nerds! All together in July 2023 this came to 904 composite overdose in July 2023, and 739 in July 2024. That is -18.2%. All very consistent among the indicators. Data gold mine up in here!
And now for some other states, nearly all of which have at least some 2024 data.
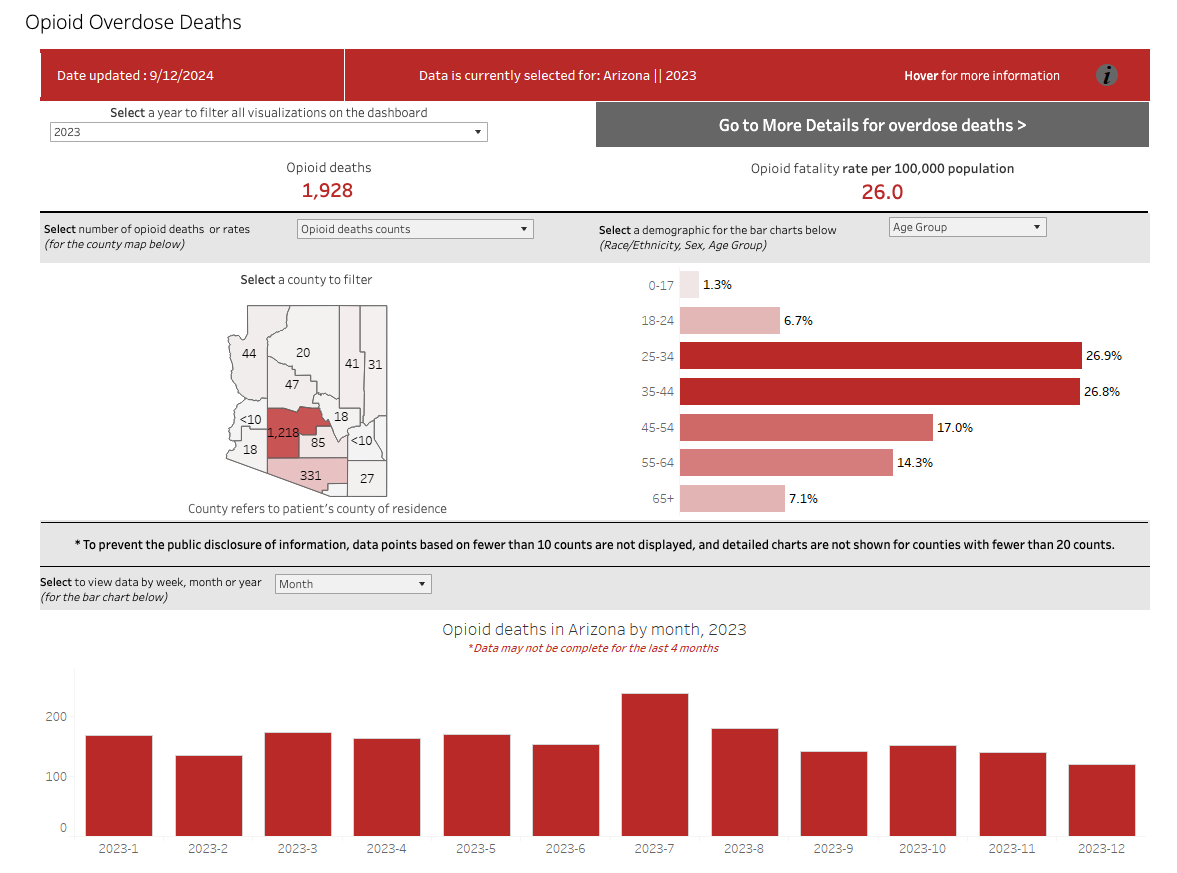
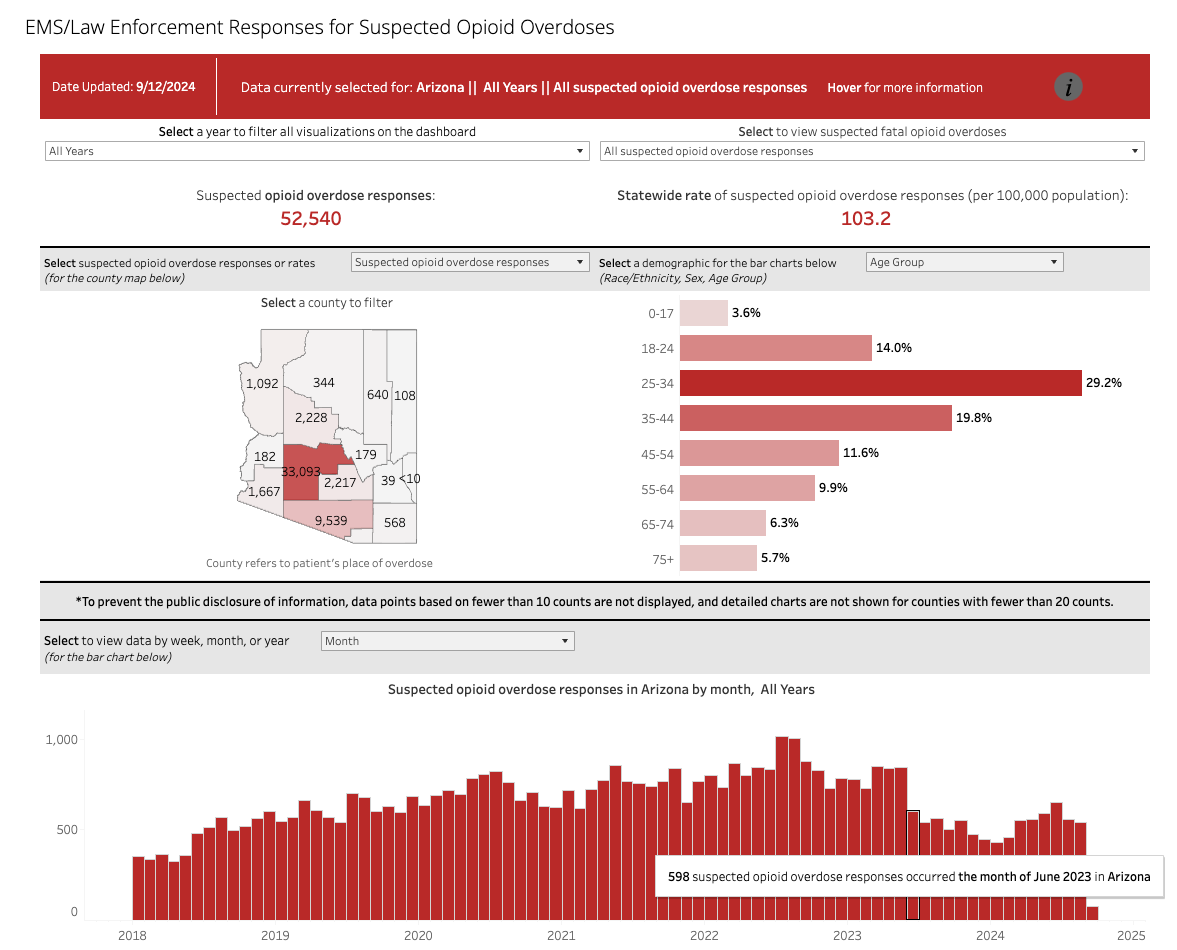
Arizona
Overdose deaths:
- March 2023: 163
- March 2024: 139
- Change: -14.7%
Hospital ED visits:
- 2023: 176.8 per 100,000 ED visits
- 2024: 152.1 per 100,000 ED visits
- Change: -14.0%
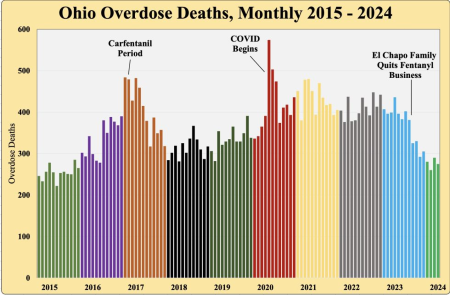
Ohio
Noticeable declines in ED visits in late 2023.
For all drug overdoses.
Dec 2022: 2,318
Dec 2023: 1,890
= -18.5%
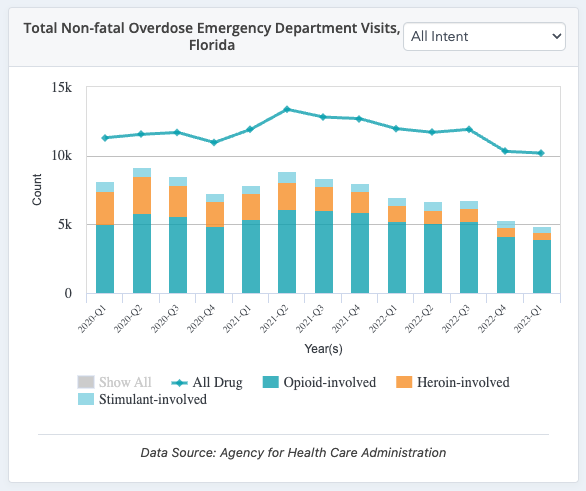
Florida
Both heroin and all-opioid ED visits in Florida were down starting in later 2022 and early 2023.
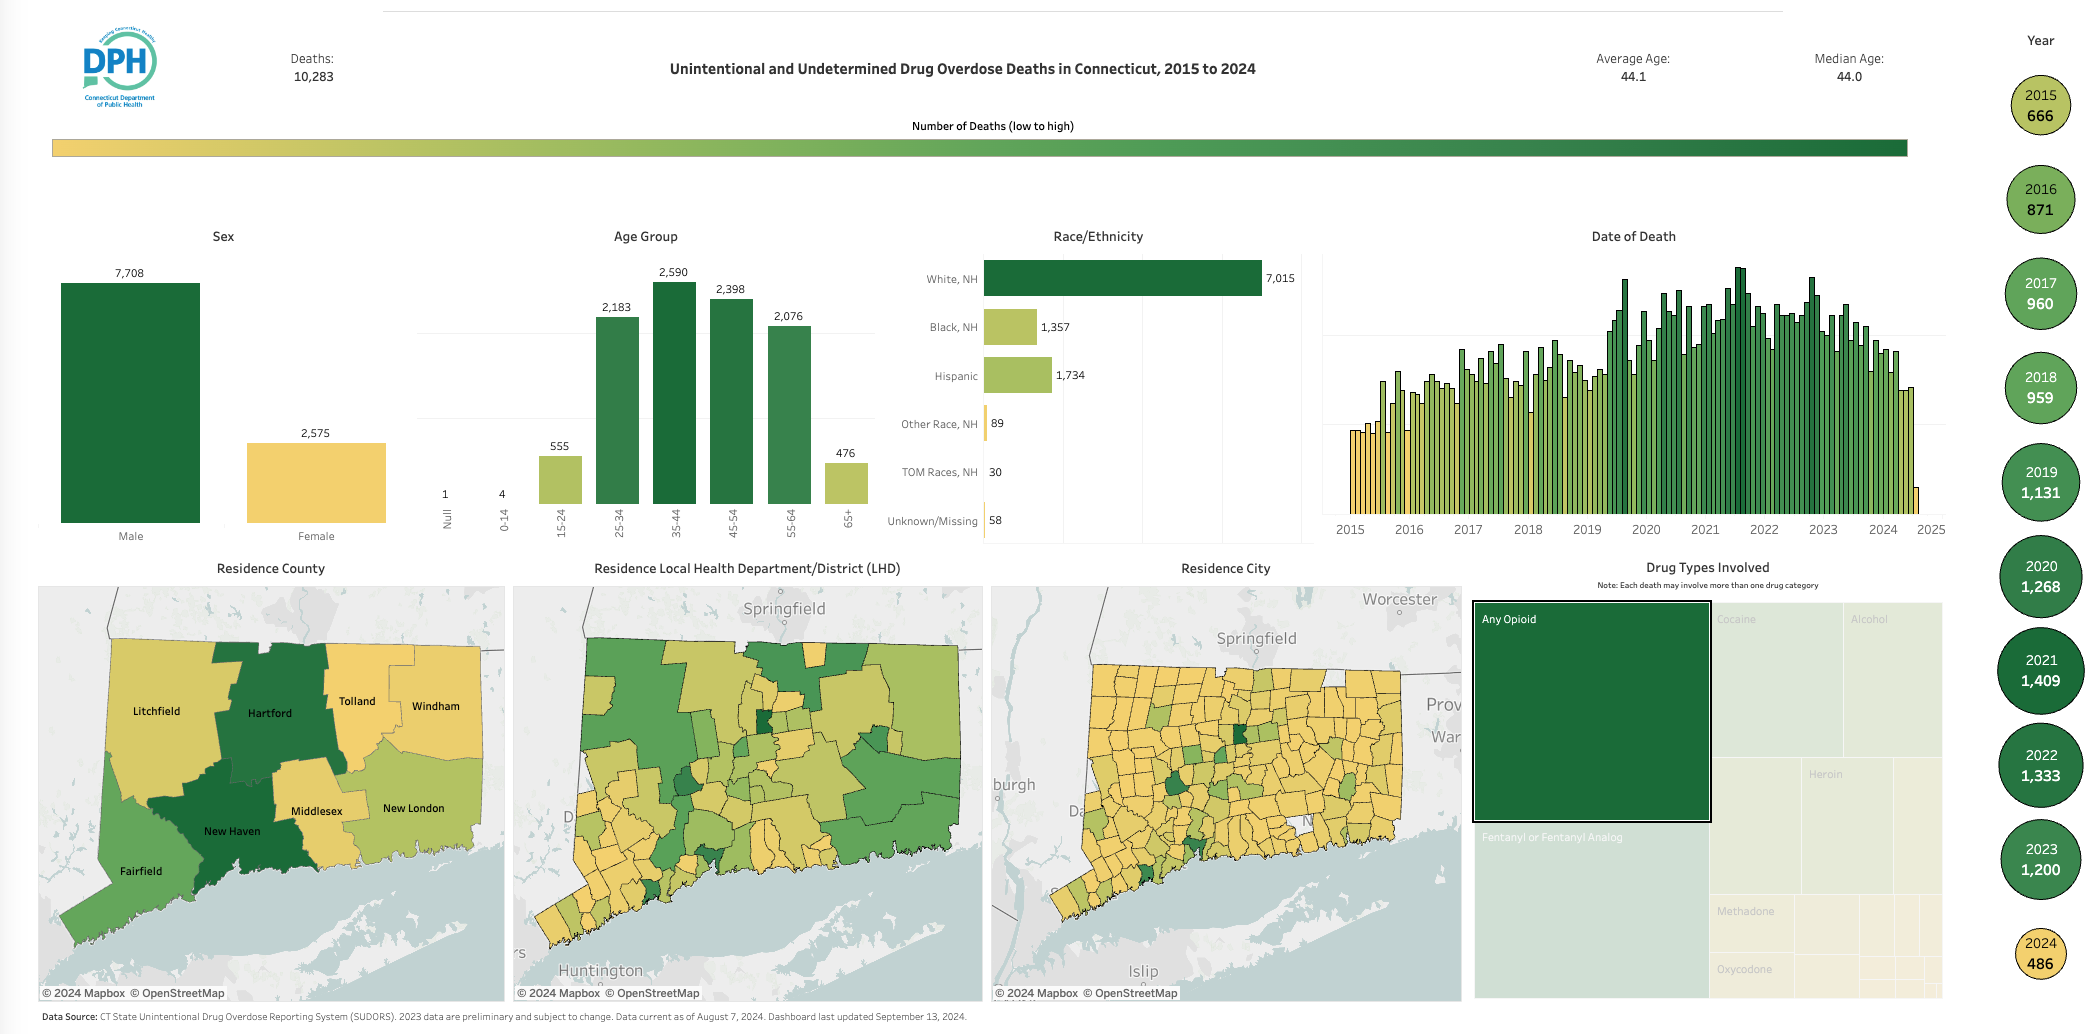
Connecticut
Major drop in OD visits starting in April 2024, to less than 100 per month.
Oregon
ED visits for opioid overdose started coming down noticeably in April 2024.
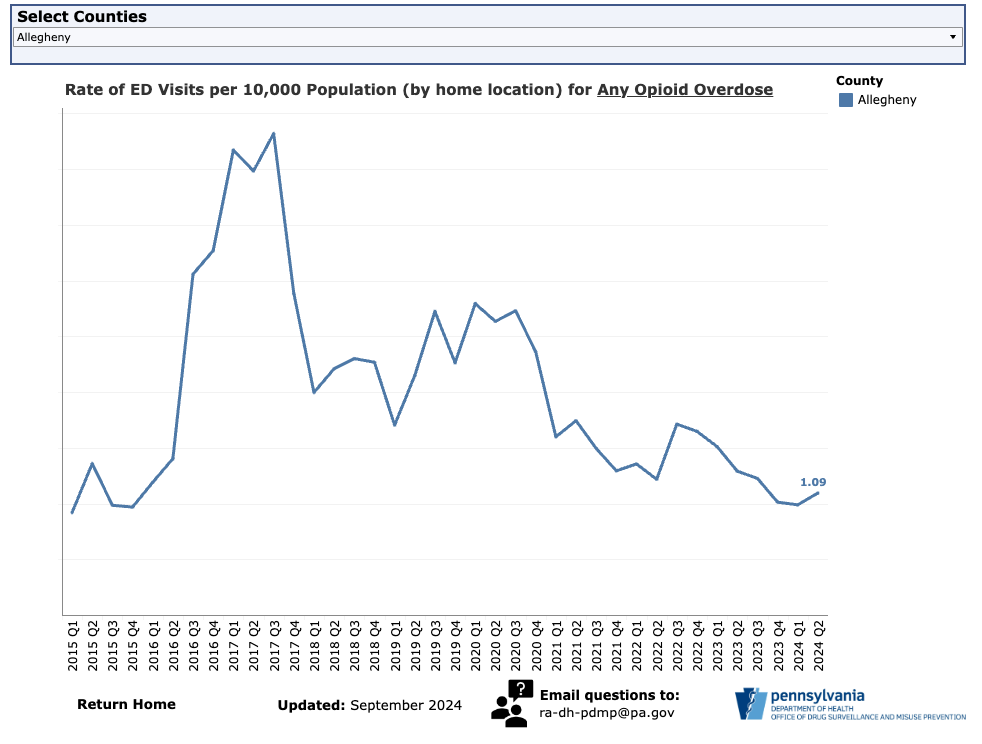
Pennsylvania
We pay attention to Allegheny County (Pittsburgh) because of our good friends at Prevention Point Pittsburgh and because we have ongoing studies there. After a spike in 2022, we see opioid overdose ED visits drop to some of the lowest levels in nearly a decade in the second half of 2023.
Alaska
Hospital ED visits
Males
July 2023: 34 per 10,000
June 2024: 40 per 10,000
Average: 37 per 10,000 ED visits
Females
July 2023: 27 per 10,000
June 2024: 32 per 10,000
Average: 29.5 per 10,000 ED visits
Change July 2023 to June 2024: -20.3%
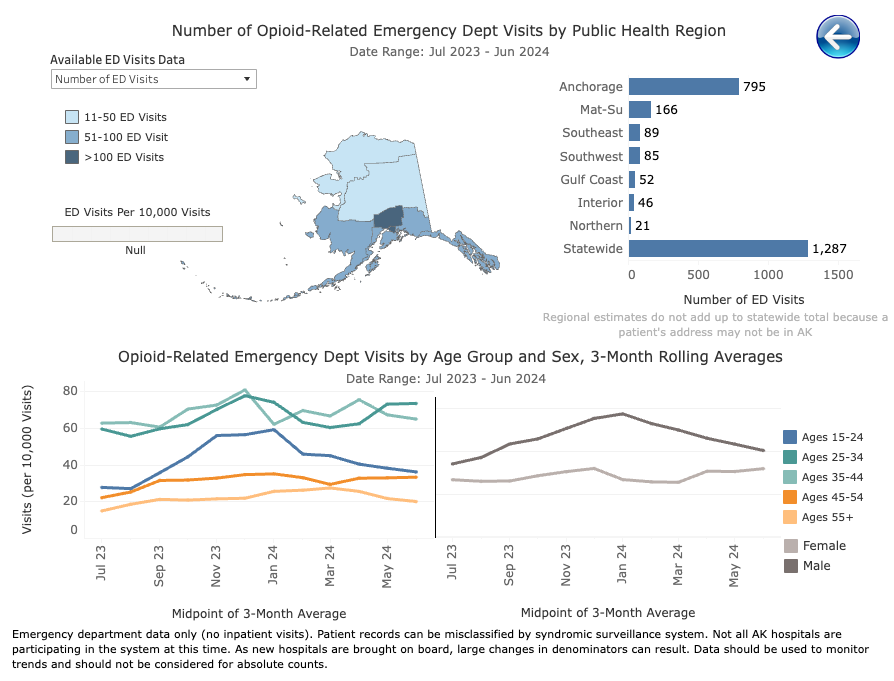
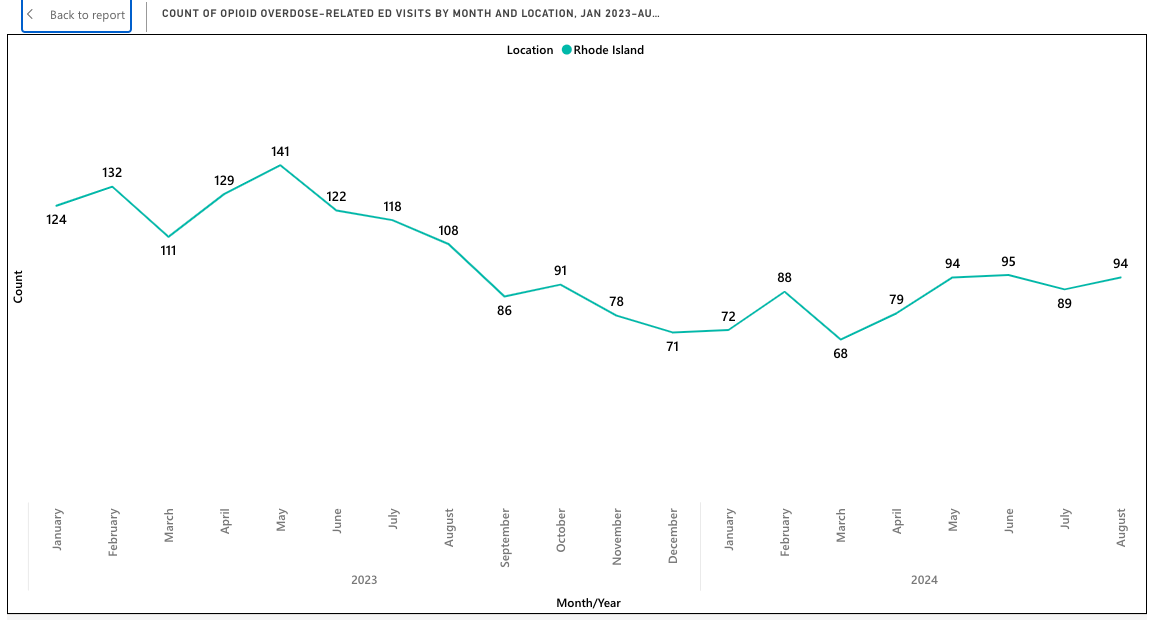
Rhode Island
Considerable drops in ED visits starting in September 2023.
Washington - King County
EMS calls for overdose trending down in 3Q2023 and dropping further into 2024.
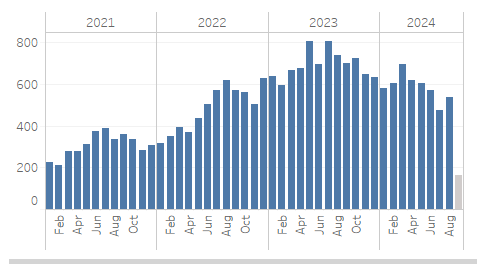
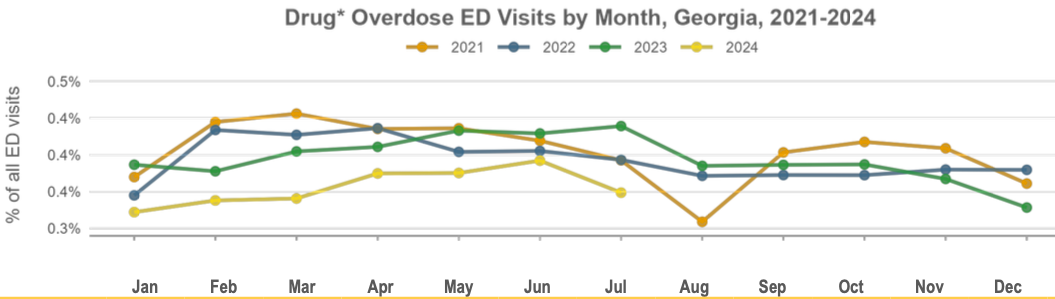
Georgia
ED visits declined from 17.7 to 14.5 per 100,000 population from July 2023 to July 2024. Trended back up over the summer months a bit.
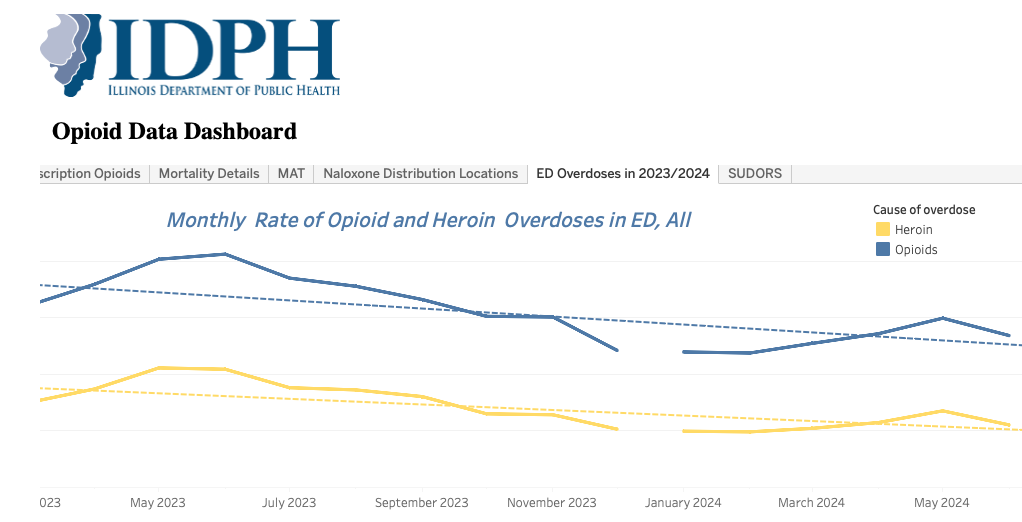
Illinois
Axis is cutoff in screen cap but see the full image here.
This is monthly count of ED visits for heroin and opioids.
May 2023: 1341
May 2024: 1003
That is a -25.2% decrease.
Maryland
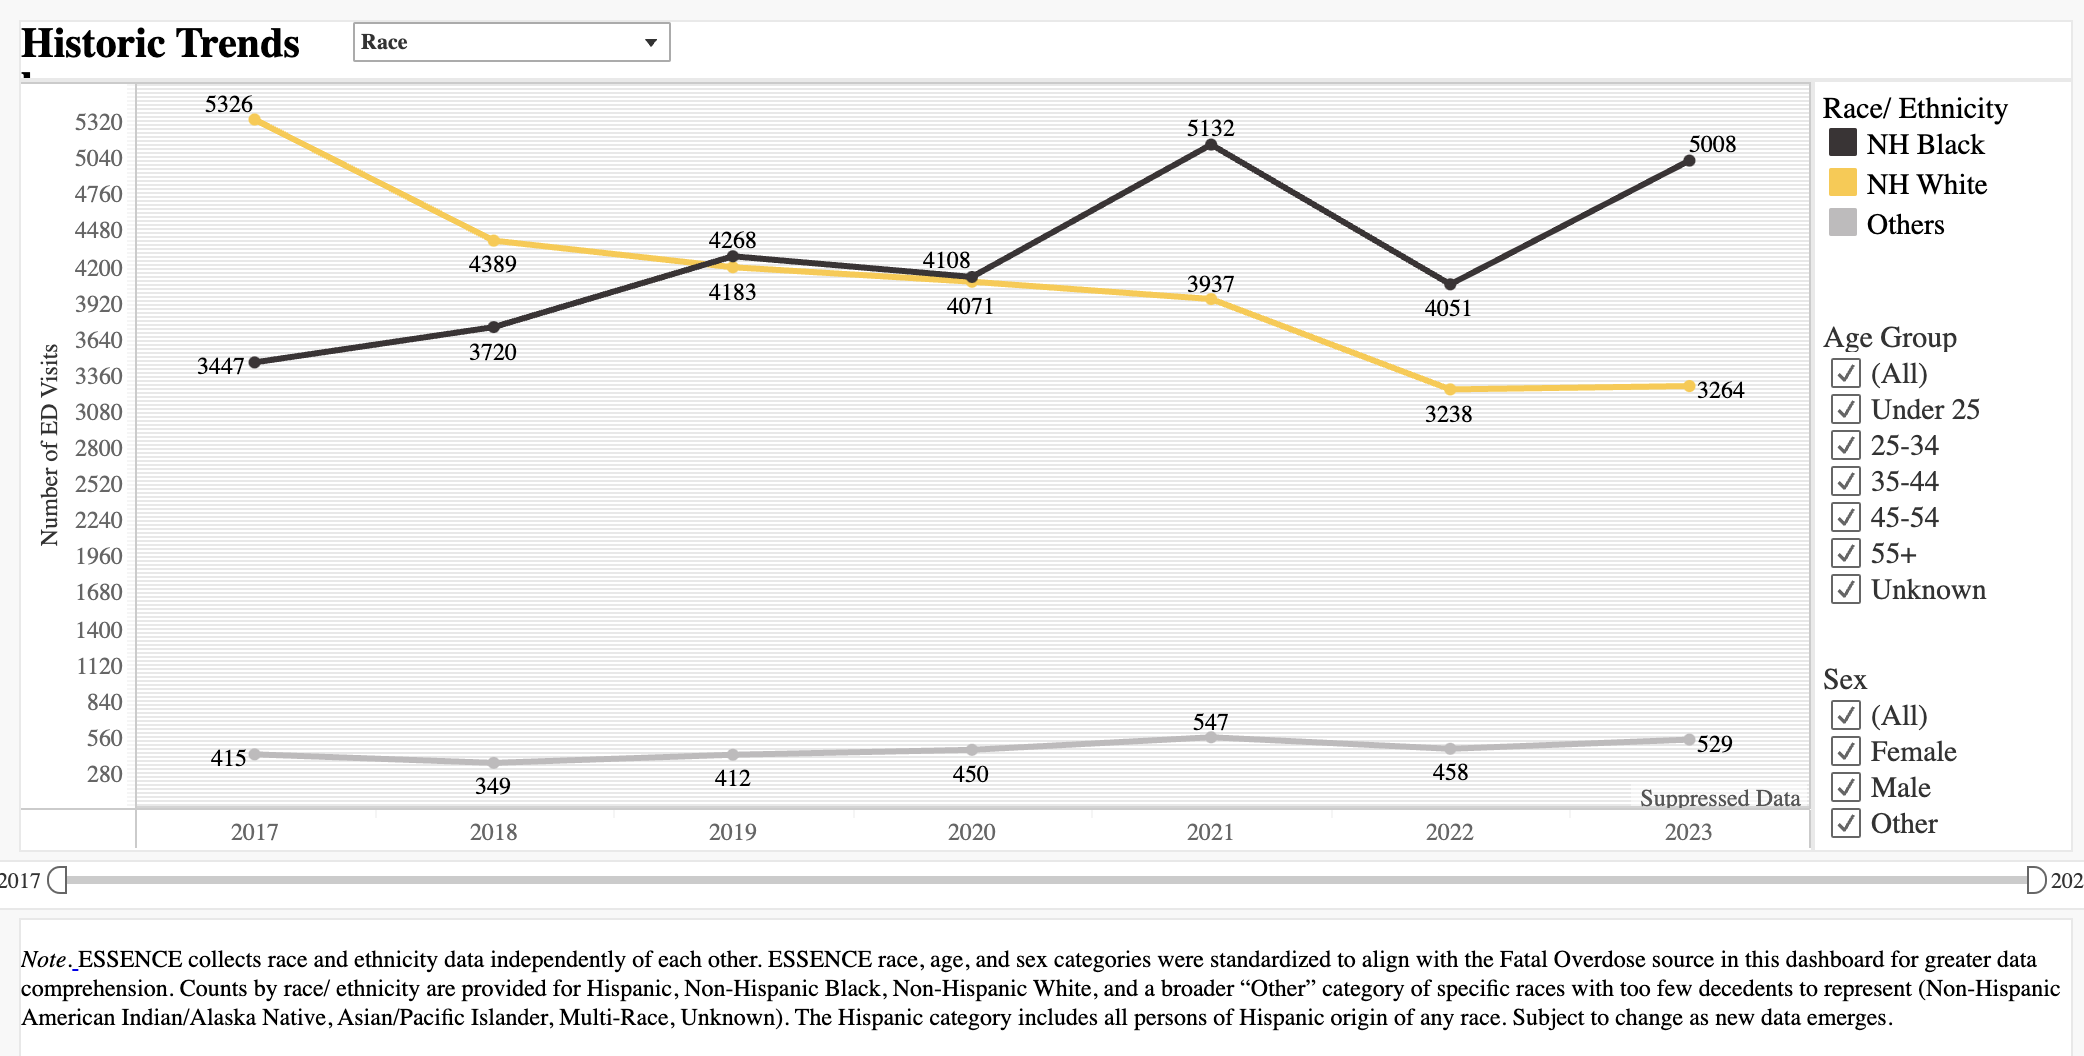
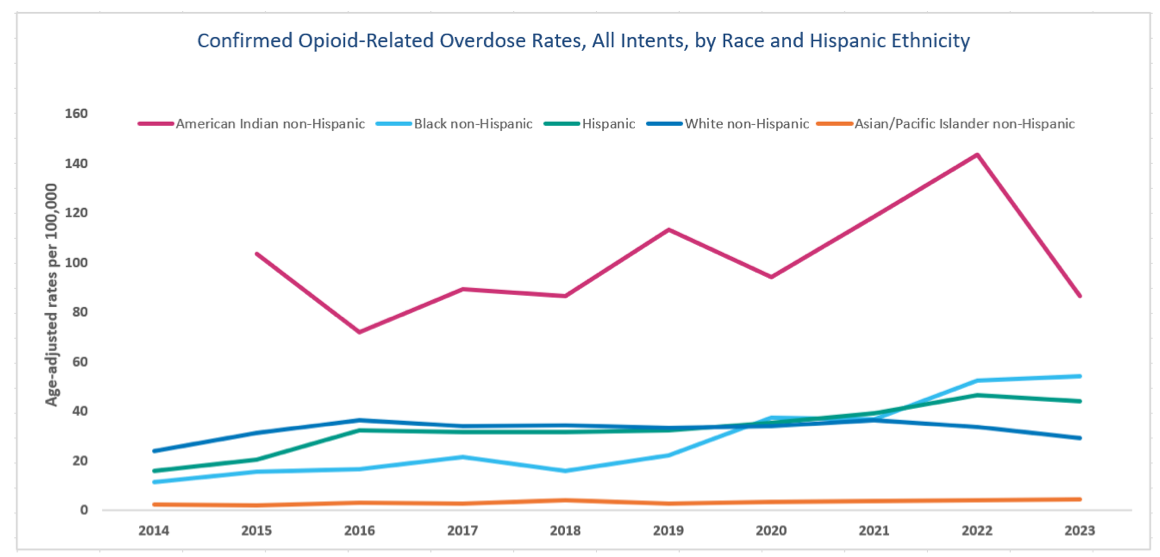
This dashboard breaks out opioid-related ED visits by 3 broad categories of race. We can see a clear downward trend of multiple years for White, but a substantial increase for Black. ("NH" = non-Hispanic).
Massachusetts
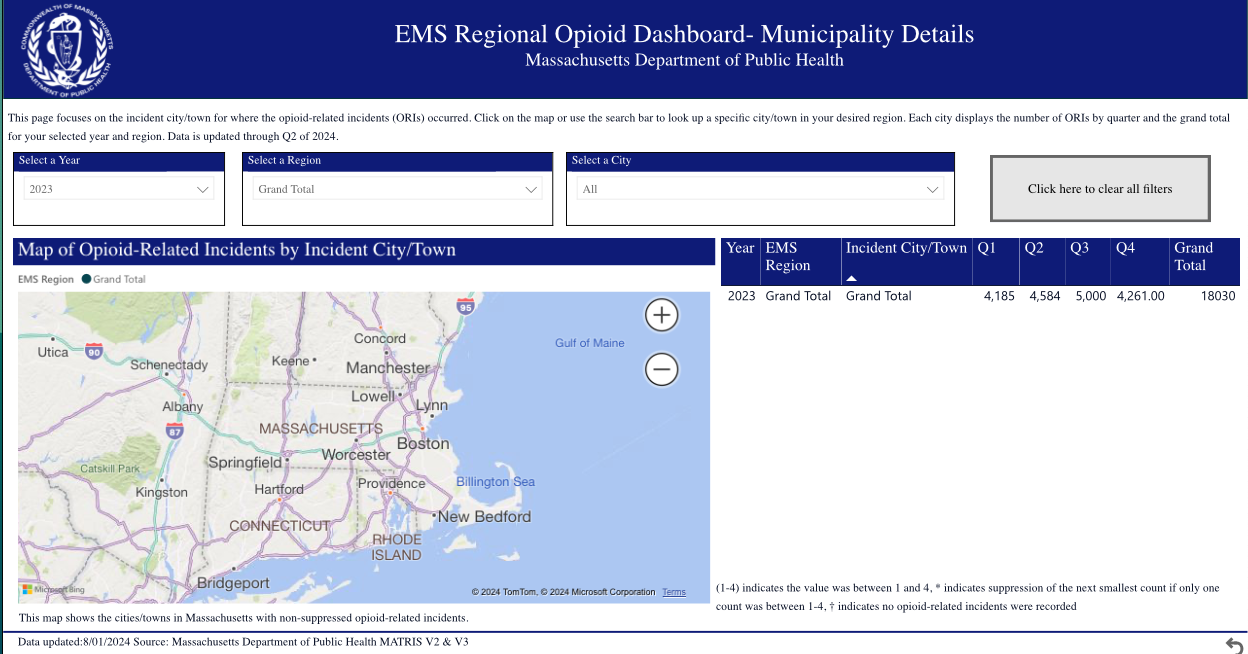
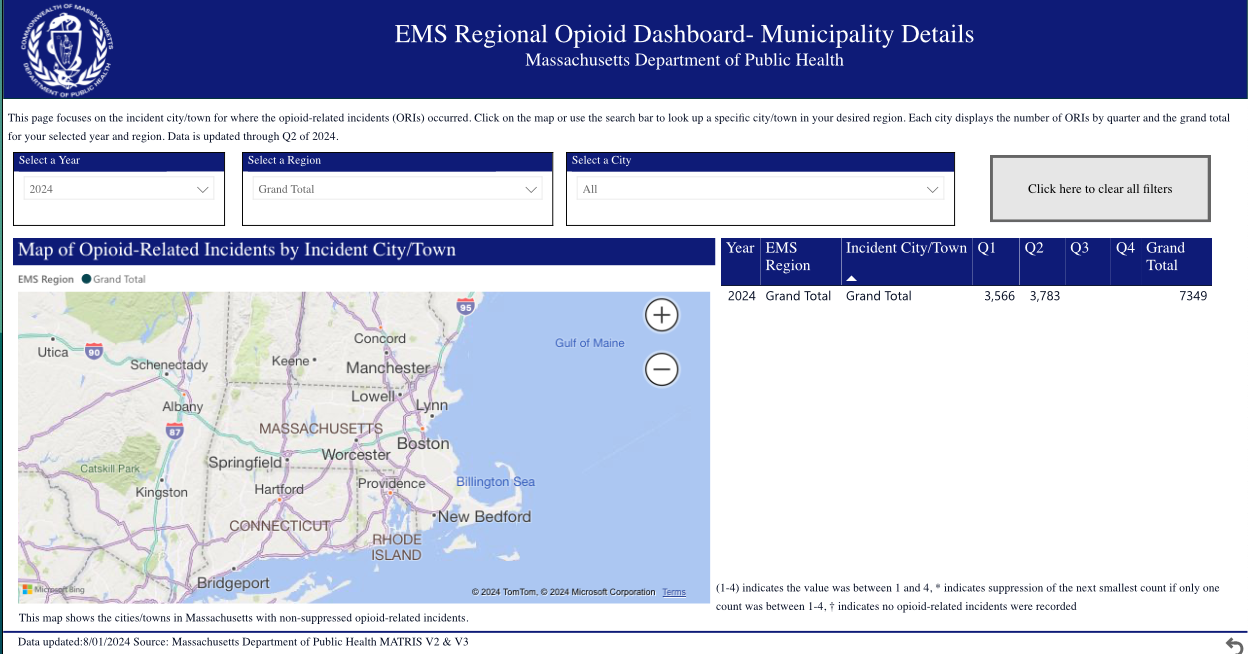
EMS responses for opioid-related incidents and severity categories (dead on arrival (of opioid overdose), acute opioid overdose, opioid intoxicated, opioid withdrawal, and other opioid-related incident).
1Q2023: 4,185
2Q2023: 4,584
3Q2023: 5,000
4Q2023: 4,261
1Q2024: 3,566
2Q2024: 3,783
2Q2023 vs. 2Q2024: Down -17.5%
From 2022 to 2023 there was a -10% decrease in overdose deaths.
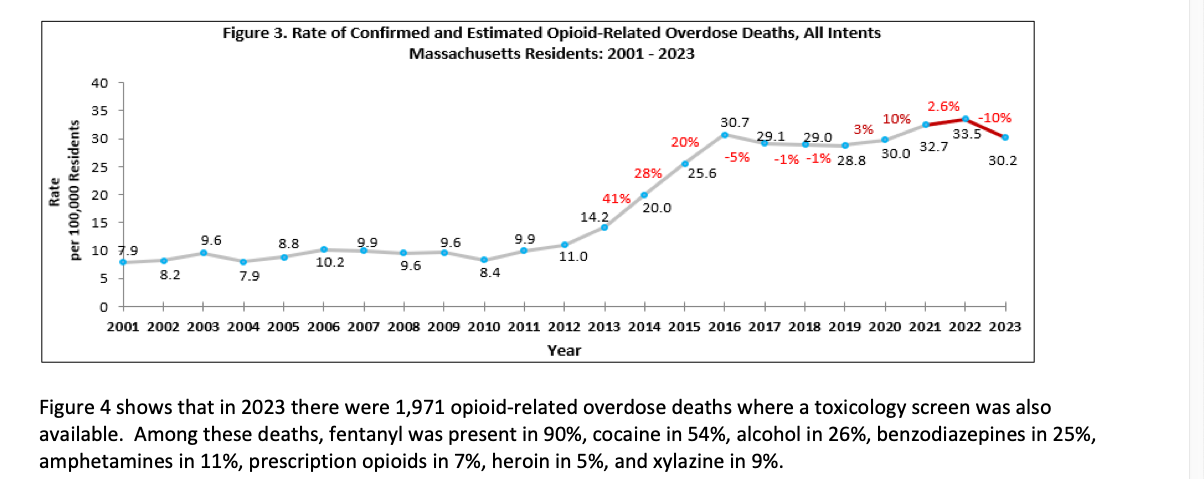
But for the sake of full transparency, worth looking at the opioid overdose mortality data which show don't show a decrease in 2024 but understandably have a lot of pendings.
The Massachusetts health department wrote to us after the blog was initially published and pointed out that the decreases in deaths in 2023 (vs. 2022) were not evenly distributed.
Our Perspective
A 15-20% decrease in non-fatal overdose and a 10% decrease in fatal overdose is a major impact. There is barely any public health intervention that has credibly achieved this magnitude of decrease.
Our conclusion is that the dip in overdoses is real, and not a data artifact. It remains to be seen how long it will be sustained. If it is sustained, whatever caused it would be one of the strongest "interventions" ever witnessed in this domain of public health. Therefore, we need to next consider the possible causes.
2. Why are Overdoses Down?
8 hypotheses from across the board
Eight Hypotheses Why
(also meaning we'll piss everybody off with this post, ha!)
- Removing barriers to drug treatment
- Increased distribution of naloxone
- Law enforcement operations at US-Mexico border
- Cartel arrests and fentanyl shipment restriction
- Depletion of susceptibles
- Marijuana legalization
- Xylazine reducing overdose severity
- Transition to smoking & price
Let's put one hypothesis to rest: Reductions in opioid analgesic prescribing is not driving the changes in overdose rates. We've studied it, and that's not what is driving current fentanyl overdoses.
Before we dive in – there is no single obvious answer. We've evaluated multi-intervention overdose prevention studies. It's not easy. We may never know what caused this dip, and if it will last, but it seems like folks really want to discuss this! So we provide some possibilities below.
(1) Increasing drug treatment
Assessment: We wish, but unlikely.
Evidence-based drug treatment reduces overdose, though some medications are likely more effective than others. And, alarmingly, some forms of forced-abstinence treatment increase overdose risk even more than continued drug use. So we focus on the two forms that have the most scientific credibility.
January 12, 2023: DEA eliminated extra licensing ("X-waiver") for doctors and nurses to treat patients with buprenorphine.
February 1, 2024: Made permanent the COVID-era rules that allow greater flexibility of take-home doses of methadone.
Limited data are available on
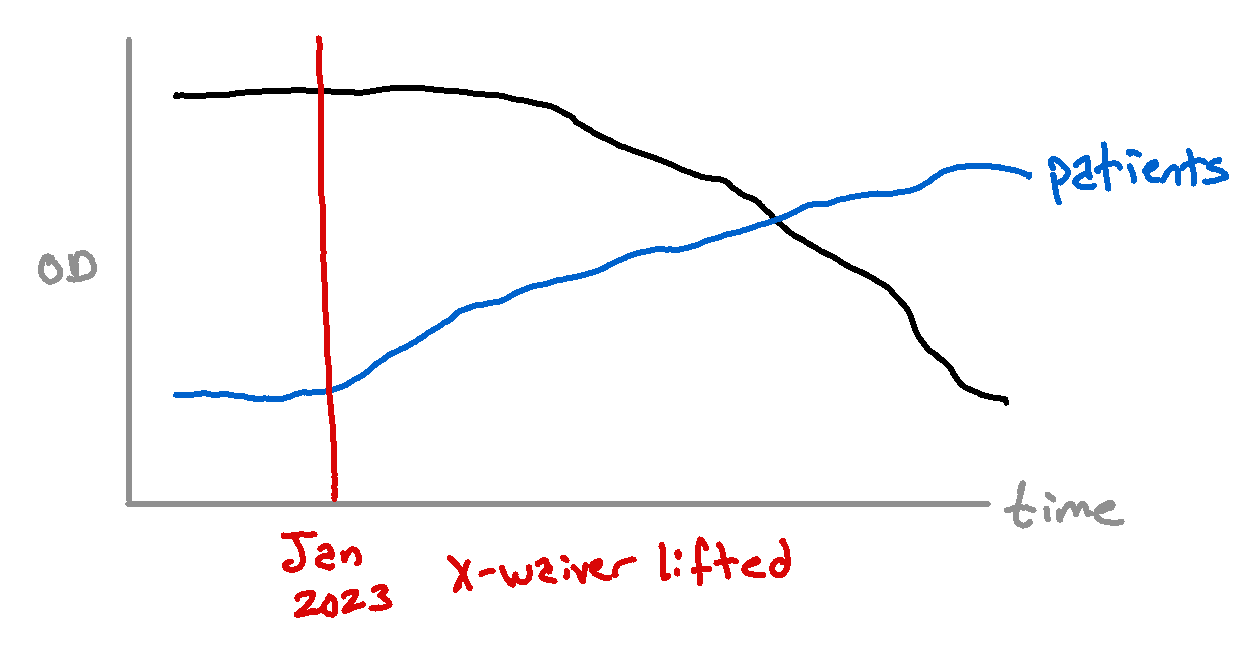
Hypothetical geographic scope: Uniform. Both rules applied to all states at once. But some states and clinics have done better than others in implementing the rule changes for medications for opioid use disorder.
These data show no change in the monthly number of patients receiving buprenorphine. That's pretty flat!
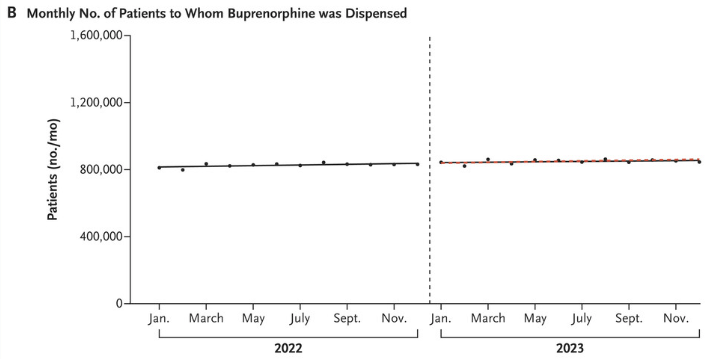
In West Virginia we can see the number of prescriptions for OUD in 2024 are at lower than previous years.
| Yes | But |
|---|---|
| Both bup and methadone are scientifically proven to prevent OD mortality | Buprenorphine initiation in era of fentanyl + xylazine has become more difficult |
| Timeframe for buprenorphine plausible, with a ramp-up period | Documented that number of prescribers increased but not patients (graph below) |
| Methadone payment and take-home policies evolved during COVID. | The 2024 rule change was a continuation of temporary changes from 2020 and should have been seen earlier. |
| Rule changes were initially lauded. | After initial improvements, methadone clinic practices gravitated towards more restrictive. |
(2) Increased distribution of naloxone
Assessment: Plausible for naloxone saturation plans, but requires actual implementation dates.
Assessment: Possible for OTC naloxone, but requires information on actual utilization/reversals.
August 2022: Launch of major national non-profit organization providing bulk naloxone at low or no cost to harm reduction programs.
September 2022: Naloxone saturation plans via SAMHSA SOR implemented massive scale-up of naloxone distribution via state health departments. Some variation in starting time is likely; saturation plans in some states (like North Carolina) weren't fully implemented until 2023.
Spring 2023: Prices of naloxone nasal spray drop because of generic competitors, challenging decade-old high-price monopoly.
July 2023: Naloxone nasal sprays become available without prescription (OTC).
Naloxone saturation
Fairly rapid (3-6 month) decline in overdoses following naloxone saturation plan roll-out. This hypothesis is supported by the start of the decline in overdoses in mid-2023.
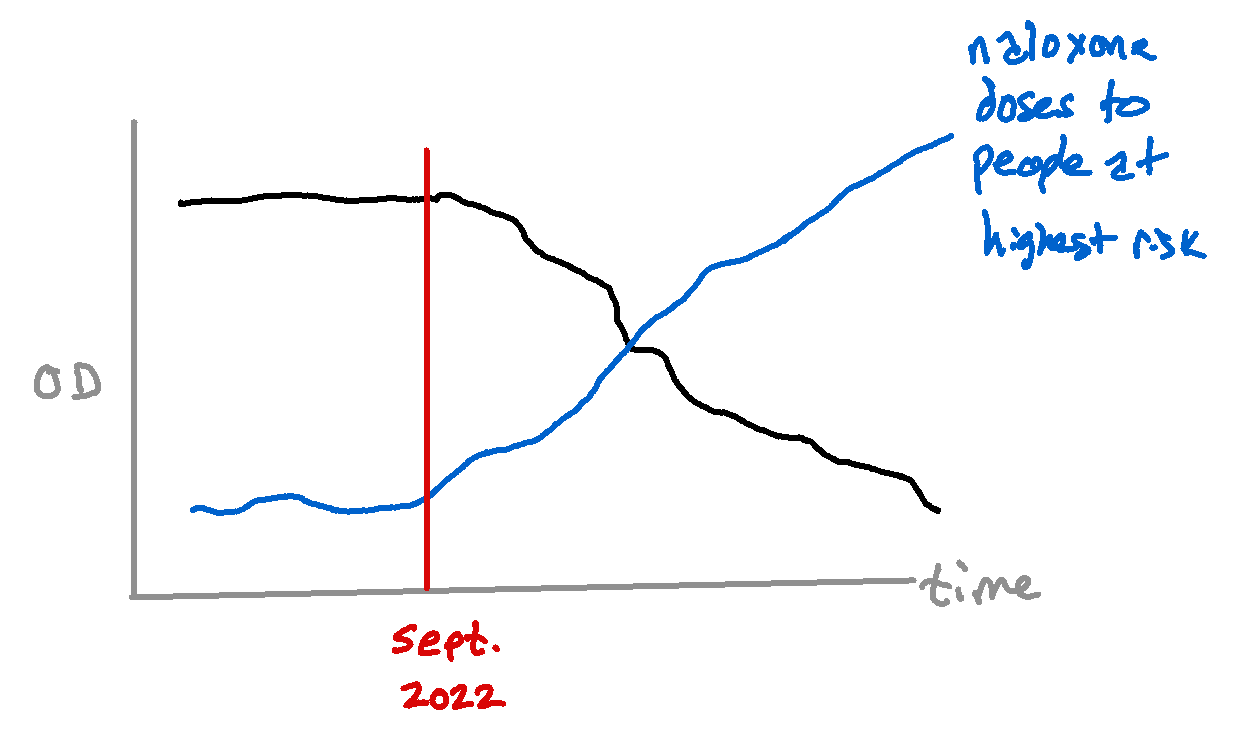
Hypothetical geographic scope: Mixed. Bulk purchasing of naloxone considerably state dependent, but saturation plans were uniformly required. East-to-west spread hard to explain, but within the realm of possibilities.
| Yes | But |
|---|---|
| Saturation showing early success | Implementation in some states started in earnest later than others, and may now just be getting off the ground. |
| Bulk naloxone distribution via NEXT Distro and RAFTP reached underserved high-risk groups. | Geographically patchy making state-level changes hard to assess. |
| Extensive SSP-based distribution to highest risk injectors | How well are they serving people who smoke? |
OTC naloxone
The drop in overdoses seemed to be happening around the time of OTC naloxone becoming available in pharmacies. But whether those doses were actually used to reverse an overdose, and in what time lag, is debatable. Still, expect pharma financial reports to feature similar graphs taking credit.
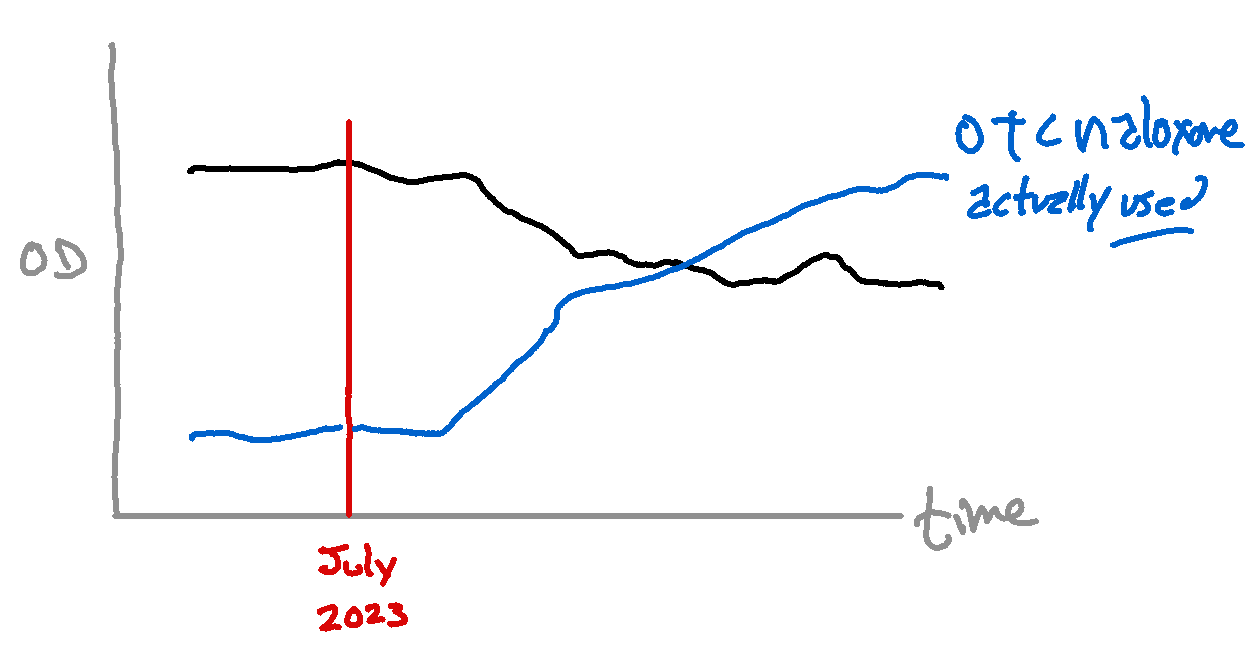
Hypothetical geographic scope: Uniform. OTC naloxone should have generally uniform distribution.
| Yes | But |
|---|---|
| Narcan manufacturer reported 22% increase in sales in 2023 | In 2Q2024 sales were down -10% |
| OTC increases number of places naloxone can be sold | In practice, hard to find and expensive |
| OTC increases access to naloxone for worried parents | Family members less likely than peers to be present during overdose |
| Naloxone available from many more venues, festivals, schools, etc. | How much actually gets used to save a life? |
COI note: ND is a co-founder of Remedy Alliance For The People
(3) Law Enforcement Operations
Assessment: Unlikely due to magnitude, temporal, and geographic inconsistency.
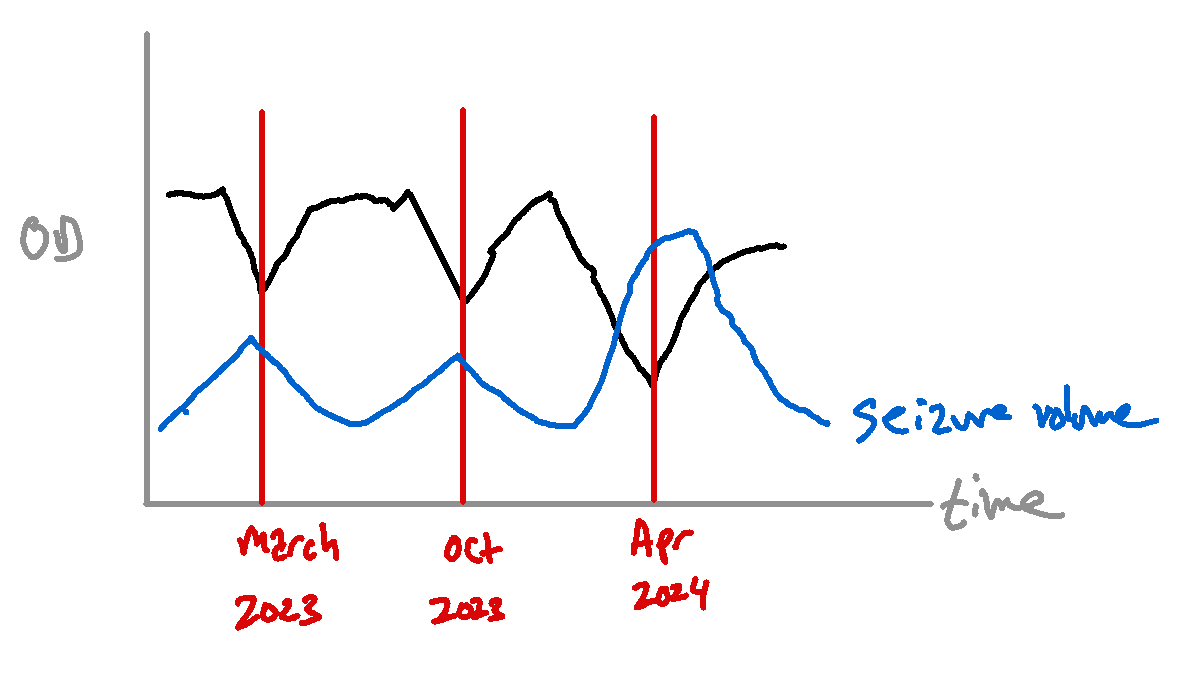
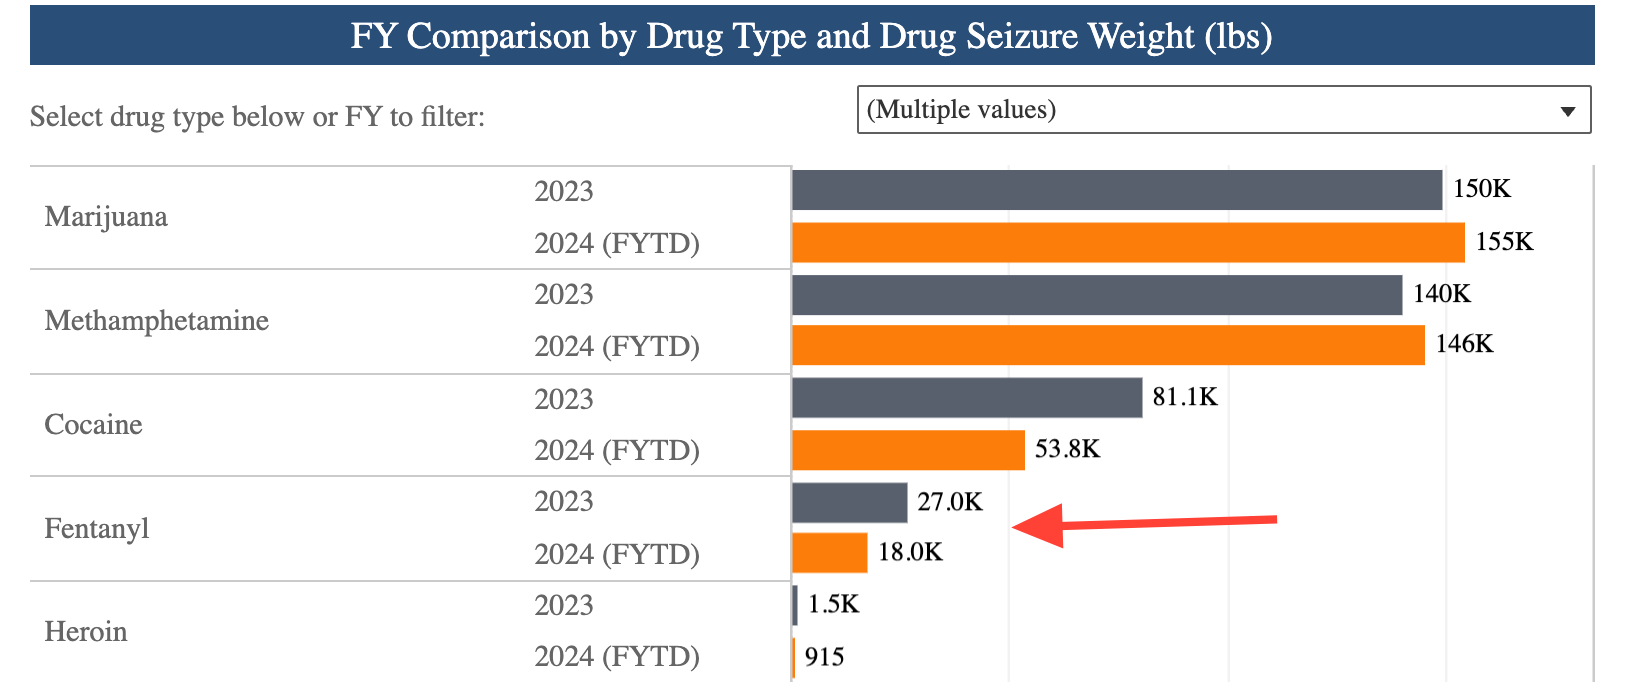
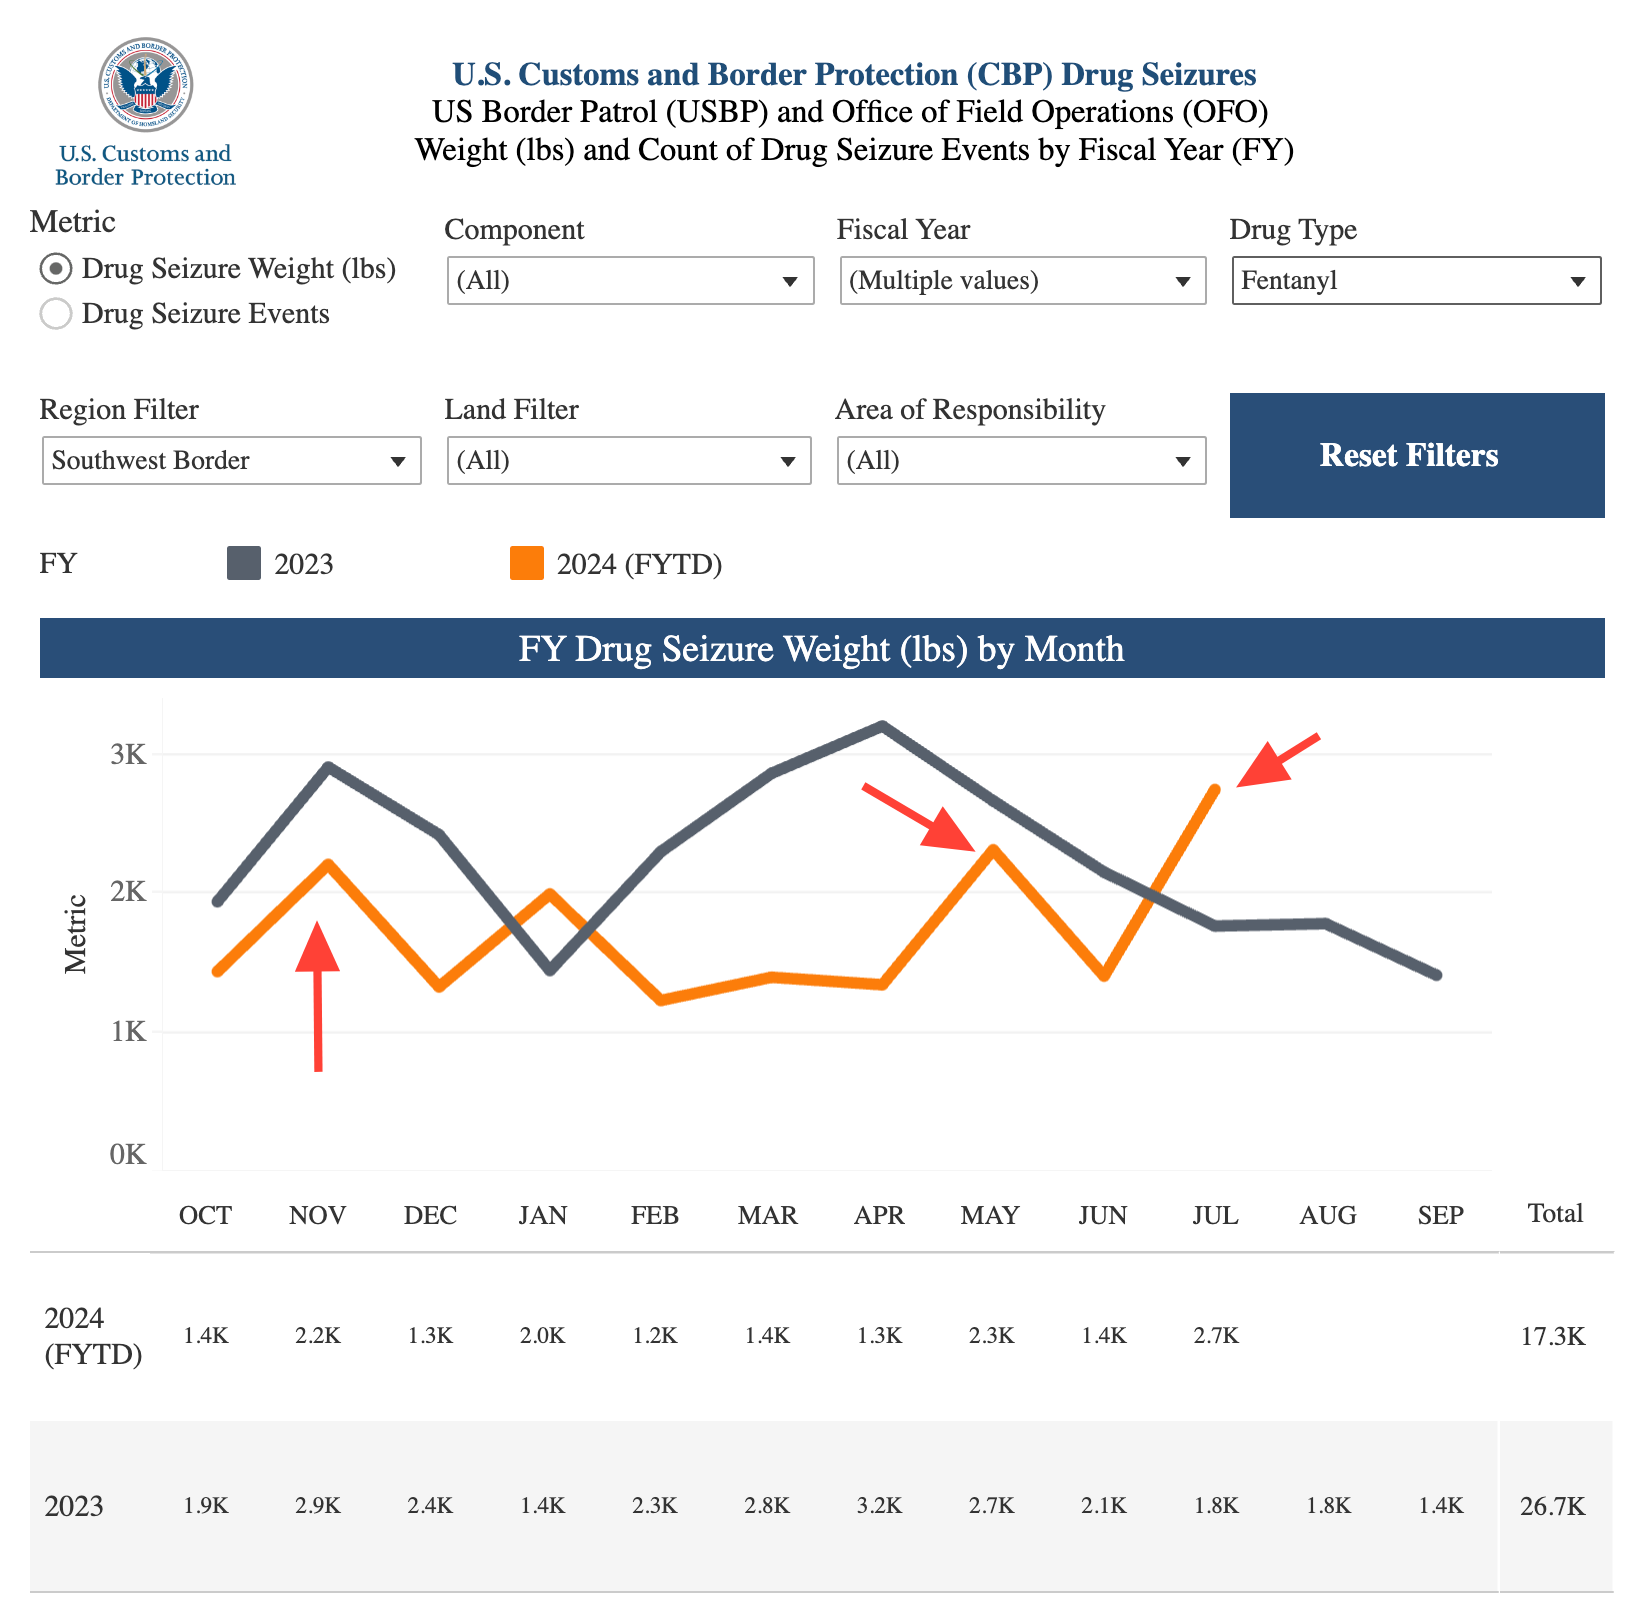
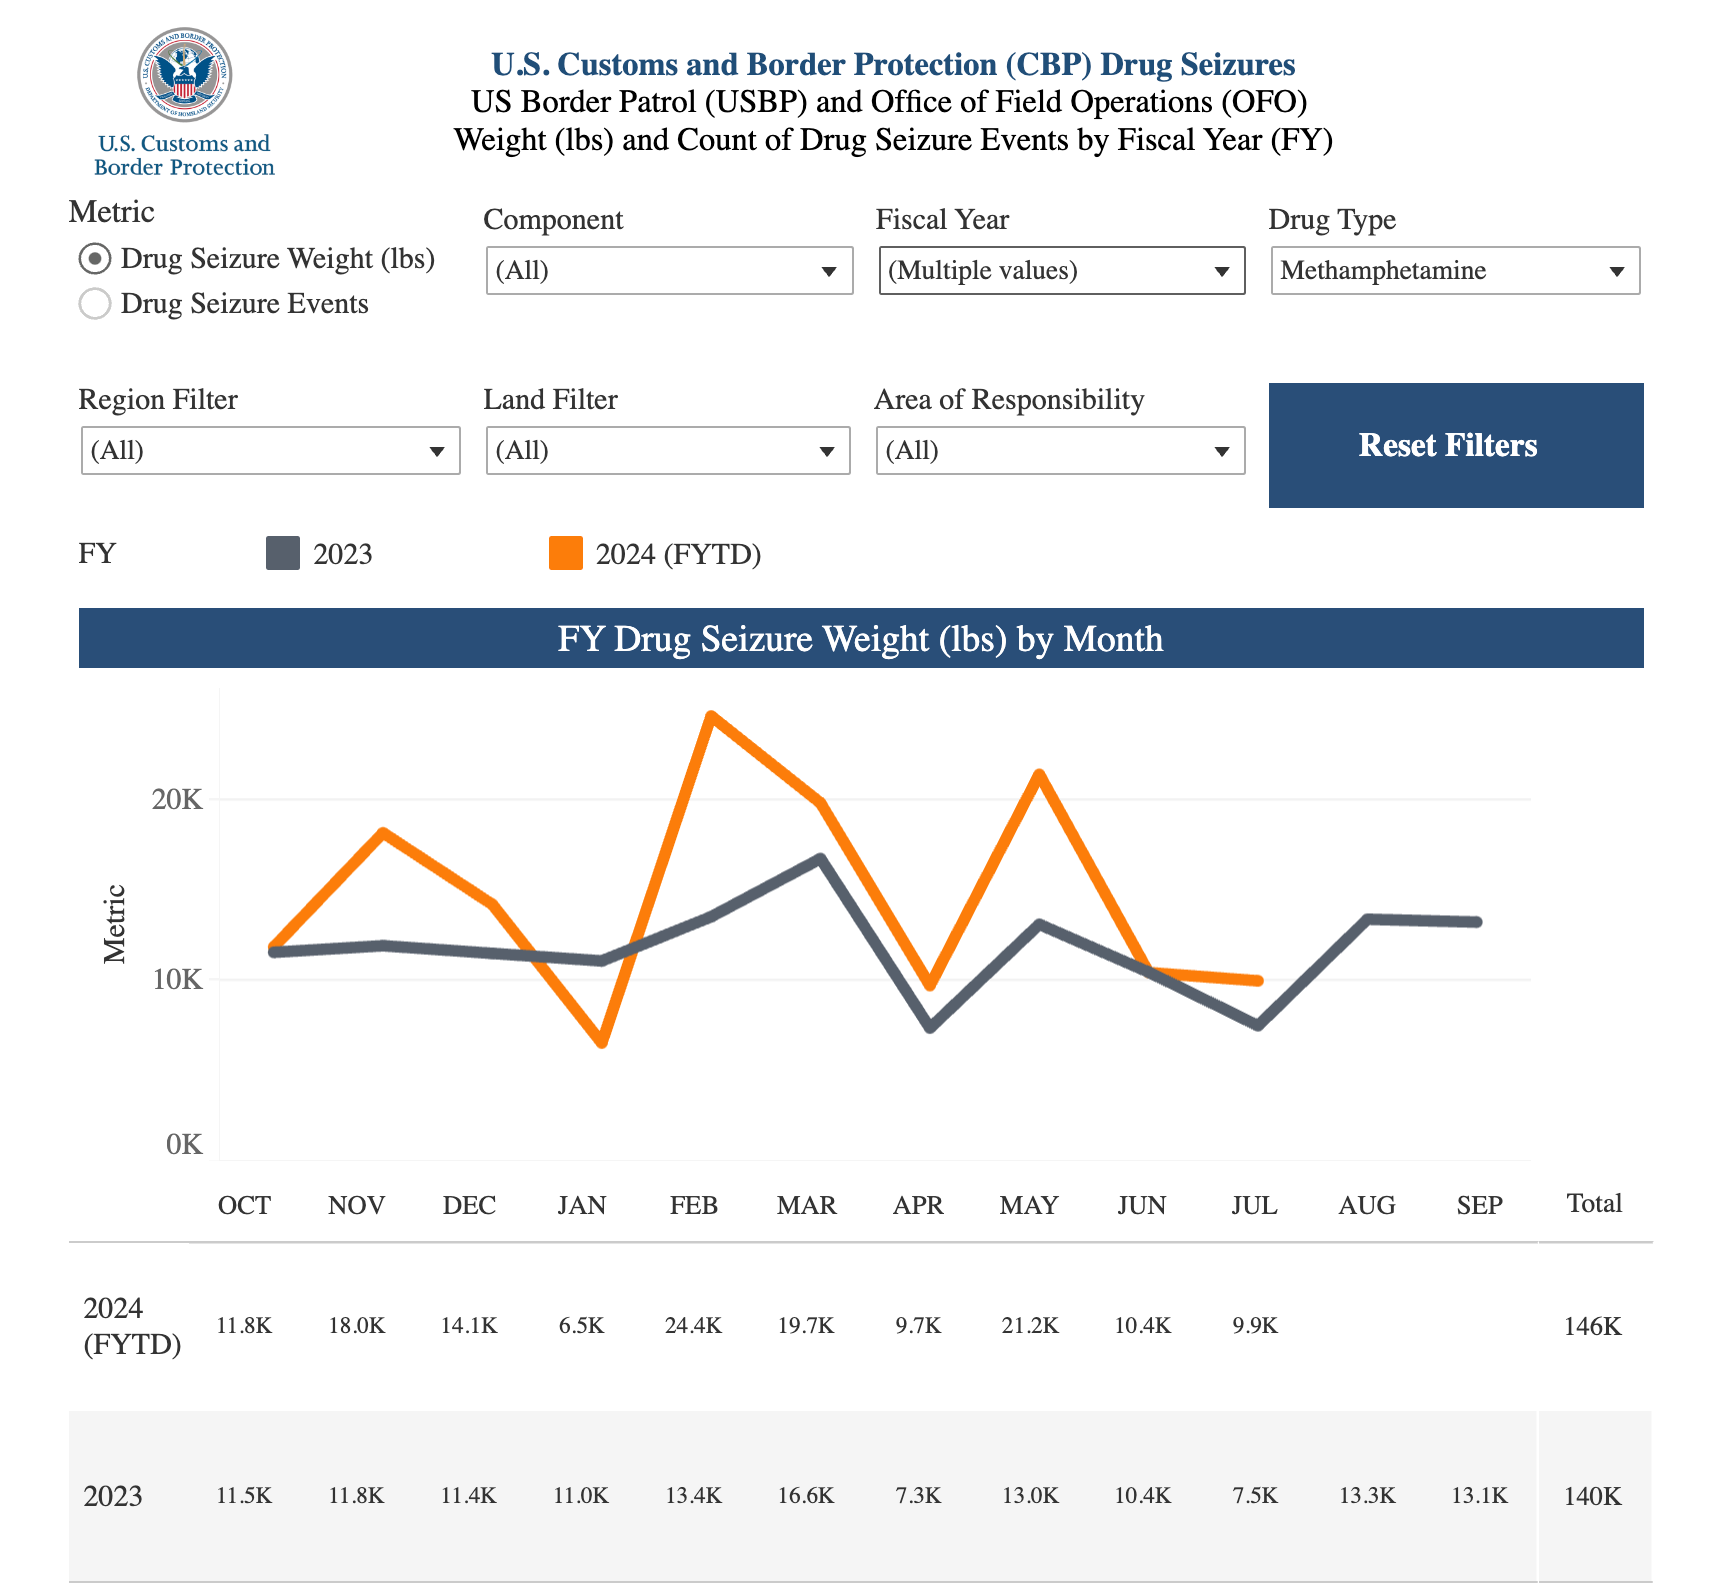
Major federal law enforcement operations disrupting entry into US-Mexico border for fentanyl and methamphetamine. One operation is designed to interrupt the flow coming into the US, while the other intends to disrupt logistics by specifically targeting 27 micro-networks responsible for last-mile delivery. Operation Apollo saw heavy increased inspection and arrests at ports of entry first in CA on a smaller scale, and ramped up in AZ months later. We can measure the volumetric impacts of Operation Apollo directly, but impact of Operation Plaza will have to be measured indirectly. Operation Apollo has had a steady stream of local news coverage.
March-April 2023: Increase in fentanyl seizures at border
October 2023: Operation Apollo California
April 2024: Operation Apollo Arizona
April 2024: Operation Plaza Strike
If border actions have been effective in reducing ODs, we would expect correlations with overdose deaths at around the time of major seizures. Put another way, we would expect a spikey decay instead of a smooth one. Data below from CBP also show that the vast majority of the interdiction was for marijuana and methamphetamine, with fentanyl being a relatively smaller amount by weight.
One view of the supply chain is that we would expect to see large impacts from interdiction to show up 6-8 months after interruptions due to the massive amount of fentanyl in the supply chain. We would also expect to see an increase in replacement fentanyl manufacturing, which could be tracked by analyzing chemical signatures in fentanyl.
Hypothetical geographic scope: Directional. Immediate impact in border states; secondary but widespread impact throughout continental US where supply doesn't originate from other trafficking networks. Alternatively, we would have to assume trafficking occurs in a chain, with ad
| Yes | But |
|---|---|
| How could you not have an impact by removing hundreds of thousands of pounds of product from the street? | Most of the seizures are meth and marijuana |
| Impact felt immediately | Drug supply becomes more adulterated and dangerous; may increase overdose (see below) |
| Plaza strike goes after logistical leaders of fentanyl and meth trafficking | Plaza Strike yet to announce successes |
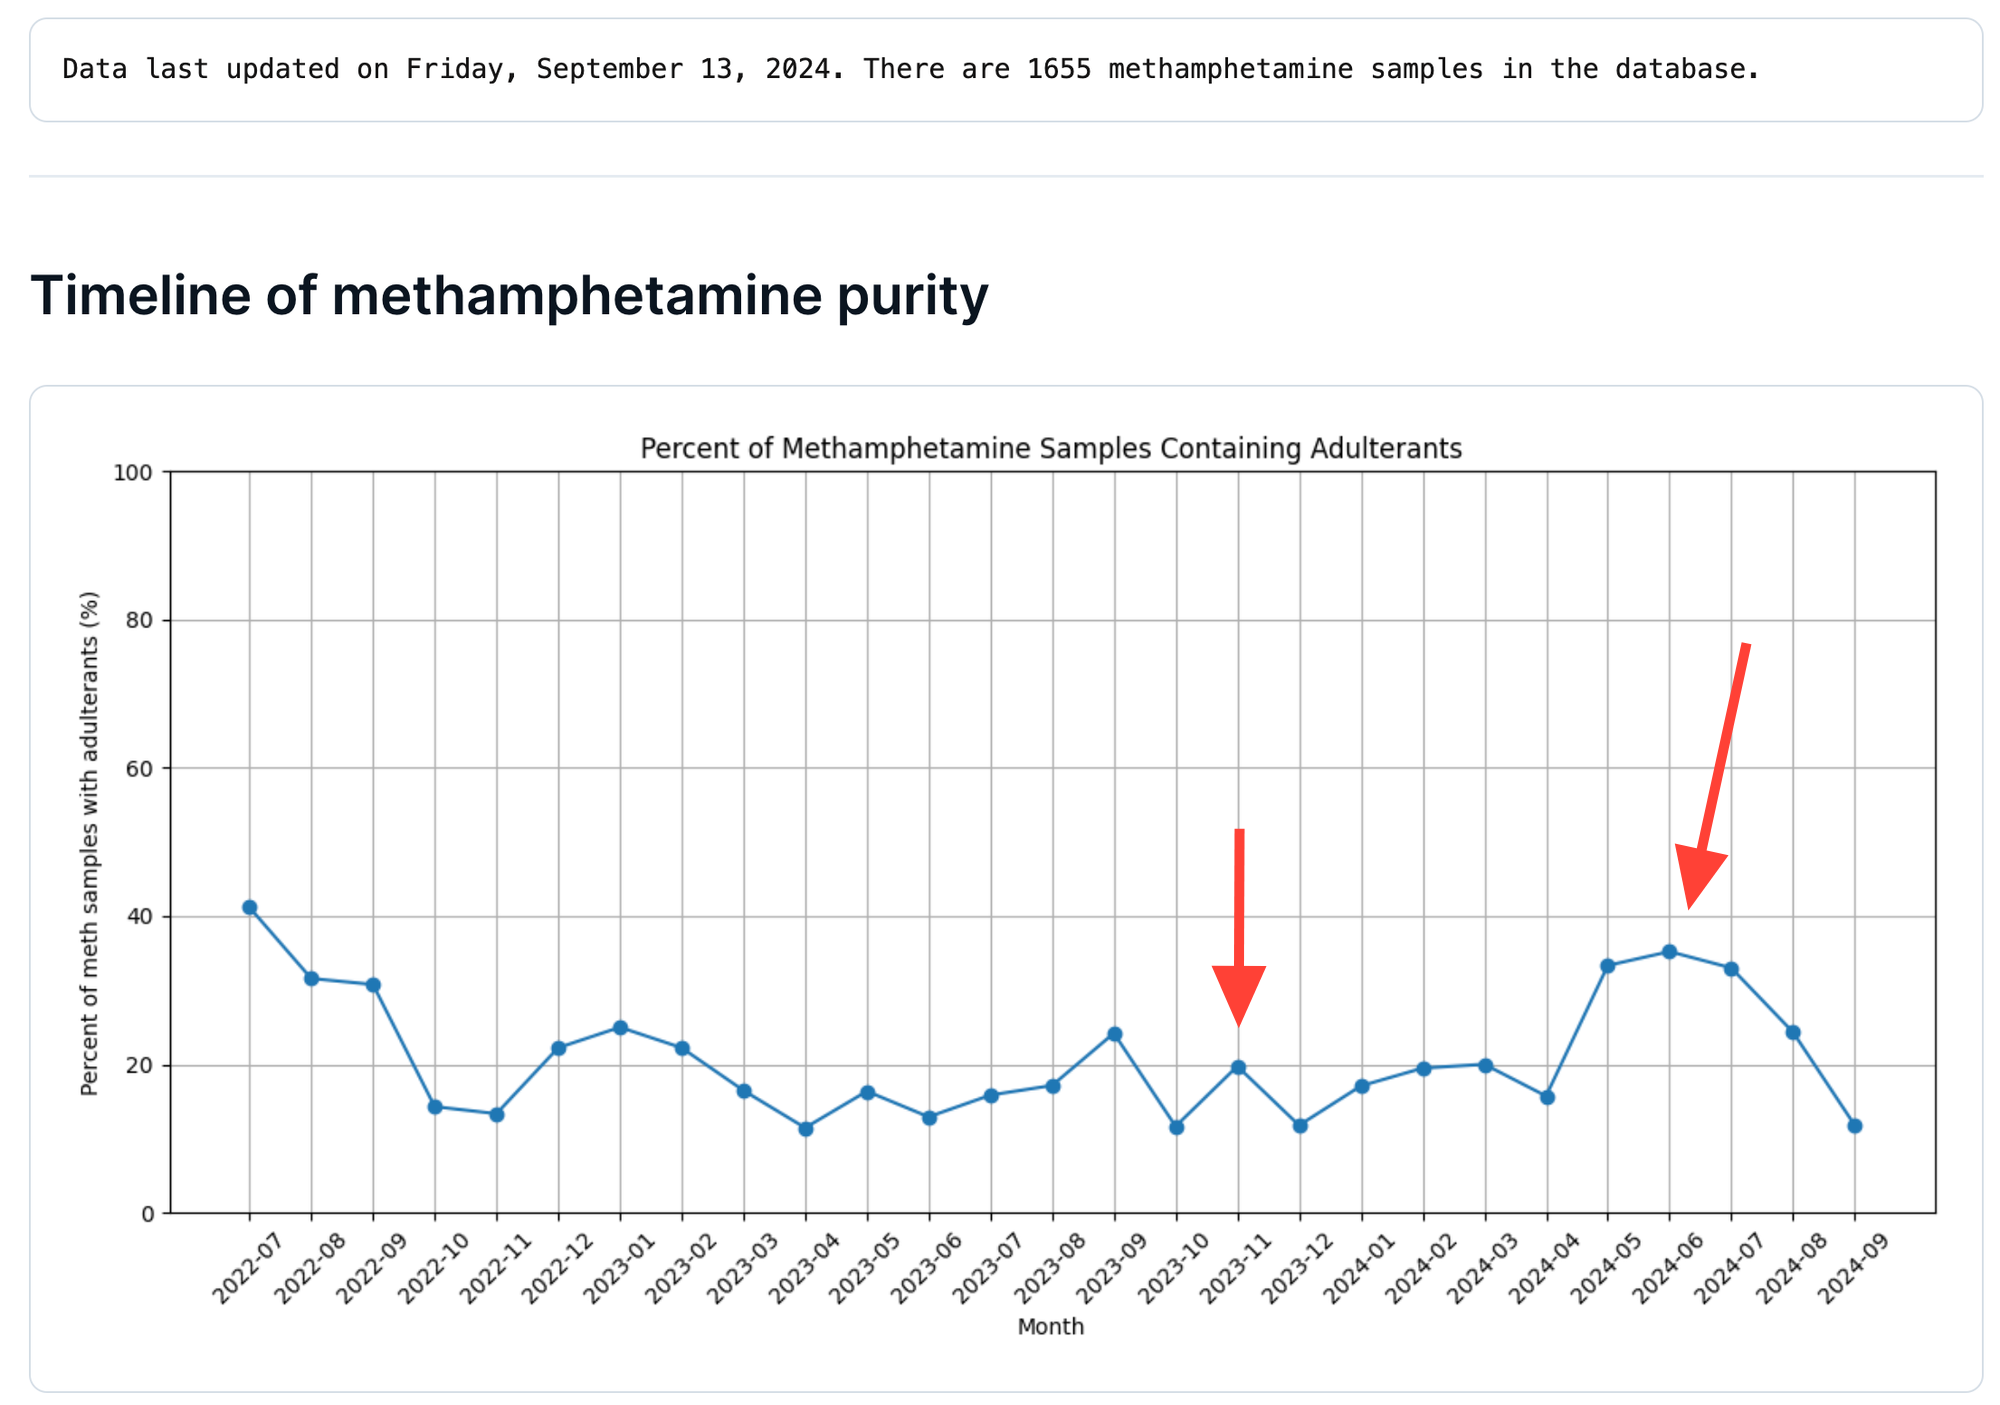
Interestingly, our Meth Purity Tracker is sensitive enough to register the spikes in methamphetamine adulteration that follow increases in drug seizures. We detected a sudden increase in meth adulteration over the Summer, starting in May 2024, exactly corresponding to the increase in border seizures. The number one adulterant of meth was fentanyl. So, the impact of the border seizures may be bi-directional: Decreasing fentanyl-only overdoses and increasing fentanyl-methamphetamine overdoses.
Yikes, these graphs are hard to line up visually, so this will be a deep dive for another blog post.
(4) DTO Changes
Assessment: Let's see how this plays out with rivals.
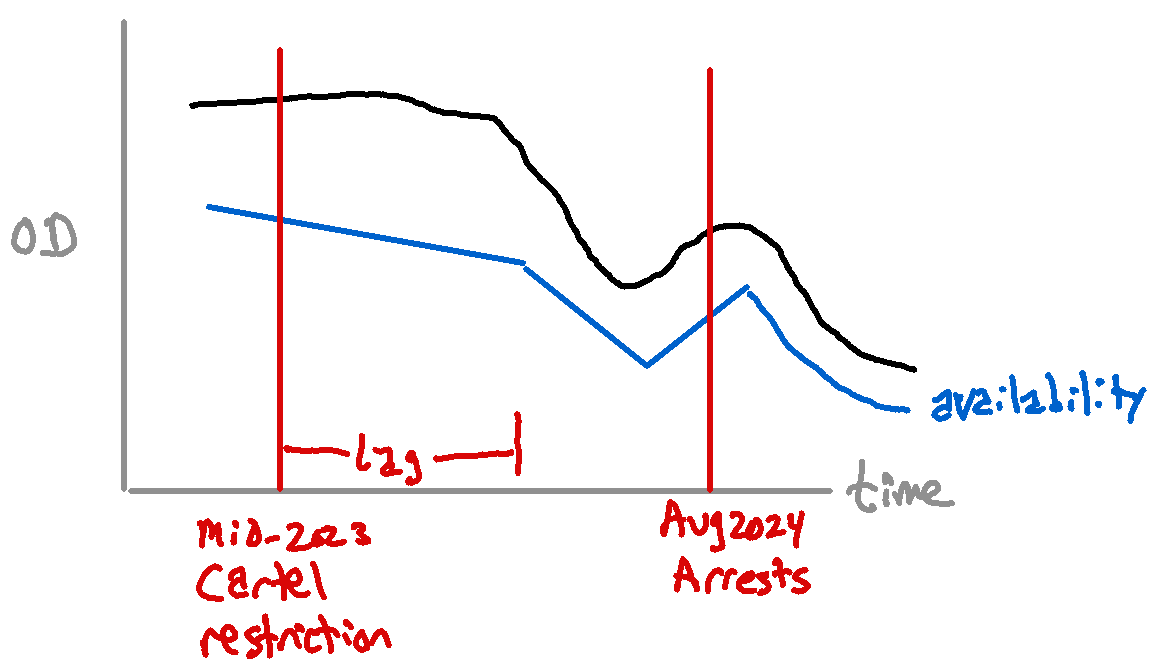
"DTO" is copspeak for "drug trafficking organization." One of the most intriguing hypotheses was brought to our attention by Dennis Cauchon in Ohio in this pair of posts in early August. A major producer of fentanyl in México announced they would stop shipping fentanyl to the United States, enforced with brutality. In October 2023, the Wall Street Journal reported that:
"The Sinaloa cartel, the leading exporter of fentanyl to the U.S., is prohibiting the production and trafficking of the illegal opioid in its territory after coming under increasing pressure from U.S. law enforcement, cartel members say."
(Note: Not all the authors of this post are convinced that fentanyl stopped flowing, as none of our sources have reported having a hard time finding fentanyl at any point in the last 2 years.)
Still, there was local speculation as to what was driving the decrease in overdose.
Some credit statewide drug treatment and outreach efforts, particularly those connected to fentanyl. Some point to a decline in fentanyl contamination of other drugs. And some say a drug cartel may be making good on a promise to cut fentanyl production. Regardless of the reason, those who have worked for years to reduce overdose deaths say the trend is good news. But they want to know why it’s happening, because that could help them fight the problem more effectively in the future. (Source)
And this is why we are laying out this article.
The drop in overdose deaths in Ohio is consistent in time with the limitation on fentanyl production. Data from CSFRE corroborate that there was a dip in the amount of fentanyl per fake pill seized at the border coincident with the DTO restriction in time.
Further adding chaos to transnational drug markets, in mid-August 2024 US authorities announced the dramatic capture of two senior members of the Sinaloa organization. Unsurprisingly, this action, in September 2024, has led to an entirely predictable internecine conflict between successors making day to day life less liveable for the local community.
One view of the supply chain is that we would expect to see large impacts from the stop-shipments to show up 6-8 months after interruptions due to the massive amount of fentanyl in the supply chain. We would also expect to see an increase in replacement fentanyl manufacturing, which could be tracked by analyzing chemical signatures in fentanyl.
Geographically we would expect to see a bigger impact in border states. The idea of supply "chains" can be misleading: Picking up a package may not be from an adjacent state, of course. There may be a hopscotching of impact that is nearly impossible to fully quantify.
(5) Depletion of susceptibles
Assessment: Plausible, but complex.
Past exposure to a drug can decrease the present risk of a drug. Think of it like active immunity to a virus – if you’re exposed to the flu, your immune system produces antibodies and you’re less susceptible to catching it again for a while (paywall, but great example). In the same way, if you use a certain drug for long enough, you’ve developed tolerance (or practiced techniques to make use safer). This kind of partial ‘immunity-building’ can happen on a population level. And when enough folks have curtailed the risks posed by the drug supply, epi nerds would call it the “depletion of susceptibles.”
Let’s get messy and imagine that we can aggregate every person who (potentially) uses opioids based on their risk (i.e., type, amount, and route of substances used) and tolerance (i.e., physiological and practical adaptation to substances). At a population level, for any year that this aggregated ‘risk-tolerance’ gap grows, overdose is more likely. When the gap shrinks, overdose is less likely. We’re ignoring the ecological fallacy in this thought experiment. Bear with us.
The epidemic begins with prescription analgesics like oxycodone, which in the scheme of opioids, aren’t as potent as what is circulating now. Overdose rises steadily between 1999 and 2007 then slows down until stabilizing in 2010. We can reasonably assume two things in this period: That the market for prescription opioids approaches saturation, and that people who use prescription opioids gradually develops tolerance (in the senses discussed above). Hence, in the mid-2000s, the gap between the ‘sum’ of everyone’s risk and the ‘sum’ of everyone’s tolerance shrinks.
Enter heroin, slightly more potent than oxycodone. Heroin overdose rises between 2010 and 2016 then stabilizes. Now the rise is more precipitous, and there are two clear reasons: previous prescription users make the switch and need time to adjust to increased potency (and to learn their new limits, and to learn how to dose a messy, unregulated substance), and opioid-naïve folks (i.e., those using for the first time) are being introduced to a slightly stronger product than if they took prescription pills on their first go. But in time, the population adjusts to heroin. Been there, done that. Again, the risk-tolerance gap shrinks after a few years.
This is where things obviously get scary. Fentanyl – orders of magnitude more potent than heroin or most prescription pills – appears around 2014, and unsurprisingly, the rise in overdose is the steepest yet. Same process as above – switchers adjust to increased potency, opioid-naïve folks are introduced to an immensely stronger product at first go. There’s a slight deceleration between 2017 and 2019 (risk-tolerance gap shrinking?) before COVID strikes and throws a wrench in disease models everywhere. (Fentanyl overdose starts slowing again after the worst of the pandemic is over.)
Finally, we have the rise in stimulant and polydrug use (especially meth/cocaine plus opioids). This trend starts around the same time as fentanyl but really takes off in 2019. What happens here? Same same, but different: Folks switching from fentanyl only to fentanyl + stims adjust to a new version of overdose susceptibility, and the opioid-naïve are introduced to an immensely dangerous combination. Add in people-who-used-stimulants-all-along now contending with fentanyl adulteration, and you have a new risk-tolerance gap that needs time to correct.
Well perhaps that time is now, and the risk-tolerance gap is at its nadir. Are there any new susceptible populations left? We’ve reached the apex of opioid potency – fentanyl and its analogues – and cleared the additional hurdle of polydrug interactions. People who use these drugs intentionally are used to them. And people use who them unintentionally (e.g., mono meth users) have had several years to figure out what to do avoid adulteration (or have given into the reality that fentanyl is unavoidably part of their repertoire). Risk, meet tolerance.
This tolerance peak has been shared anecdotally. People who use fentanyl are reporting that they no longer use to get high but to stave off withdrawal (We hear folks say all the time, ‘You use to stay well’). It feels like the aggregate risk in this epidemic has peaked, and the aggregate tolerance has finally caught up.
Supply side, what’s next? Perhaps the cartel are happy with where the market stands – they’ve saturated their audience, demand isn’t going away, and they’ve managed to control the problem of customer attrition (i.e., overdose). Tinker around the edges with cuts to stretch profit, but otherwise let sleeping dogs lie.
Hypothetical geographic scope: Directional. Slower in states where fentanyl was introduced more recently and tolerance hasn’t caught up to risk (largely, west of the Mississippi). Oregon and Washington are good case studies, having the most months in 2023 where overdose increased over 2022. Fentanyl didn’t become prevalent in the PNW until about 2019, much later than the rest of the country.
Another take on depletion of susceptibles is grim. Chronic pain patients who have had their stable medication doses forcibly reduced are at greater risk of suicide. Rapid dose reductions of patients who are stable on opioids is known to increase overdose risk, and opioid "de-escalation" measures have driven many formerly stable patients to street supply. There is a tragic feeling among pain patient advocates we speak with that their numbers are dwindling directly from suicides. 💔 We don't know if good population level data exist to link this directly to the changes in overdose we are seeing, but depletion of susceptibles through aggressive de-prescribing is worth more thought.
(6) Marijuana legalization
Assessment: Highly unlikely without stronger evidence.
On an individual level it seems intuitive that marijuana legalization may offer some people who use opioids an alternative. "Why can't they just smoke weed?" is something that gets naively thrown around. At the level of population statistics, that association gets tenuous. The relationship between cannabis legalization and opioid overdose has been studied over and over and over and over and over and over and over and over and over again, but let's just say that the relationship at a population level is hard to see.
Regardless, the reduction in overdoses doesn't seem to follow the geographic pattern. We saw reductions in overdose the South fairly early, which has no legal marijuana, but has plenty of Delta-8 dispensaries. Still, there isn't a strong temporal connection either.
(7) Xylazine
Assessment: Whoa, really?
Carl Sagan said: "Extraordinary claims require extraordinary evidence..." (which we don't have, ha!)
This is the most provocative of hypotheses, one that has had lots of resonance with people who have actually used fentanyl-xylazine. And wholly surprisingly, it was dismissed out of hand by much of the medical establishment.
This is the only hypothesis that shows a strong east-to-west geographic spread.
Colin writes: The recent drops in OD deaths are absolutely amazing and fill me with hope. However, it is dangerous to ascribe this huge success wrongly. When looking at how the recent decreases in ODs spread across the lower 48 starting in the Eastern US and spreading Westward, many explanations that people are suggesting are responsible for this drop in deaths don’t fit, but one that I have heard from a whole lot of drug users, follows the East to West movement, and makes a lot of sense is this: Xylazine has had some unexpected benefits. Now don’t get me wrong, xylazine has some terrible effects on the human body that I wouldn’t wish on anyone. That said, what we have discovered about xylazine binding to the Kappa opioid receptors combined with the general consensus of drug users being that it seems to make the dope last longer point towards xylazine lowering the number of times one uses a drug in a day; this combined with what I assume is a lowered risk of OD from dope that is less fentanyl/analogues/nitazines/whatever, with those drugs in part being replaced with xylazine, which I’m guessing has a lower fatal OD risk profile than the aforementioned synthetic opioids. (Supported by clinical study.) Less rolls of the loaded dice.
On top of this is another, often unmentioned positive result of xylazine contamination – the horrible wounds thought to be the cause of injecting xylazine are pushing PWID to utilize different routes of administration (ROA) like snorting, smoking, and booty bumping. In some cases it might even cause folks to stop completely. While overdose is still very possible with these ROA, it is less so than with IV use – it’s easier to titrate up and such with other ROA vs IV use. But this adjustment period takes time. Once xylazine appears in the drug supply locally, people will continue to use, and experience the agitation and anxiety that comes from withdrawal due to an irregular supply. The increased chaos that folks are experiencing in places where xylazine is less than a year at less than 10% penetration may be coming from this initial period.
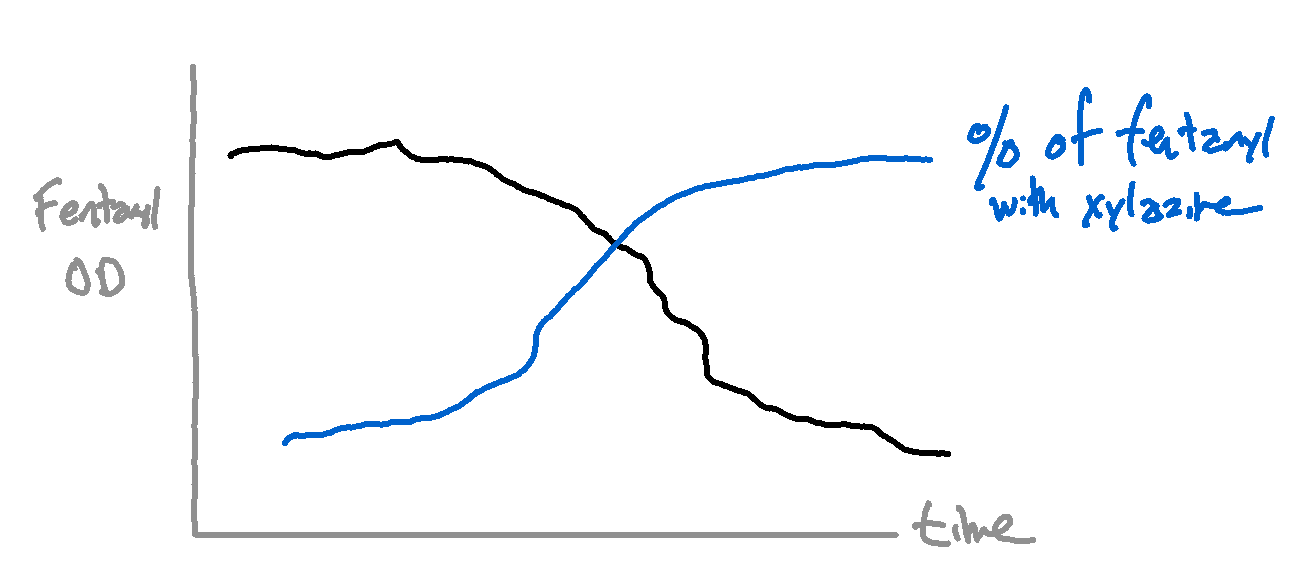
"In 2024, 36 percent of fentanyl powder samples and nearly 6 percent of fentanyl pills are adulterated with xylazine" (source). Different places reached a certain xylazine threshold, say 10% of fentanyl, at slightly different times. This hypothesis should be able to be tested using drug sample data.
Among drug seizures (2018-22):
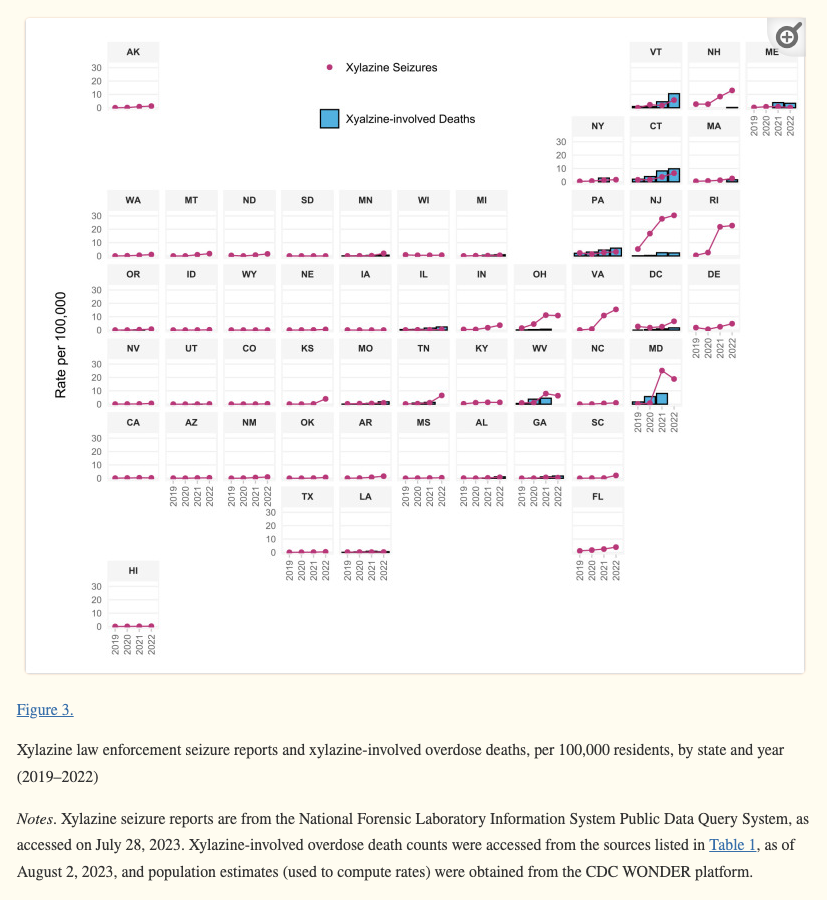
And here's our data for 2023 through August 31, 2024.
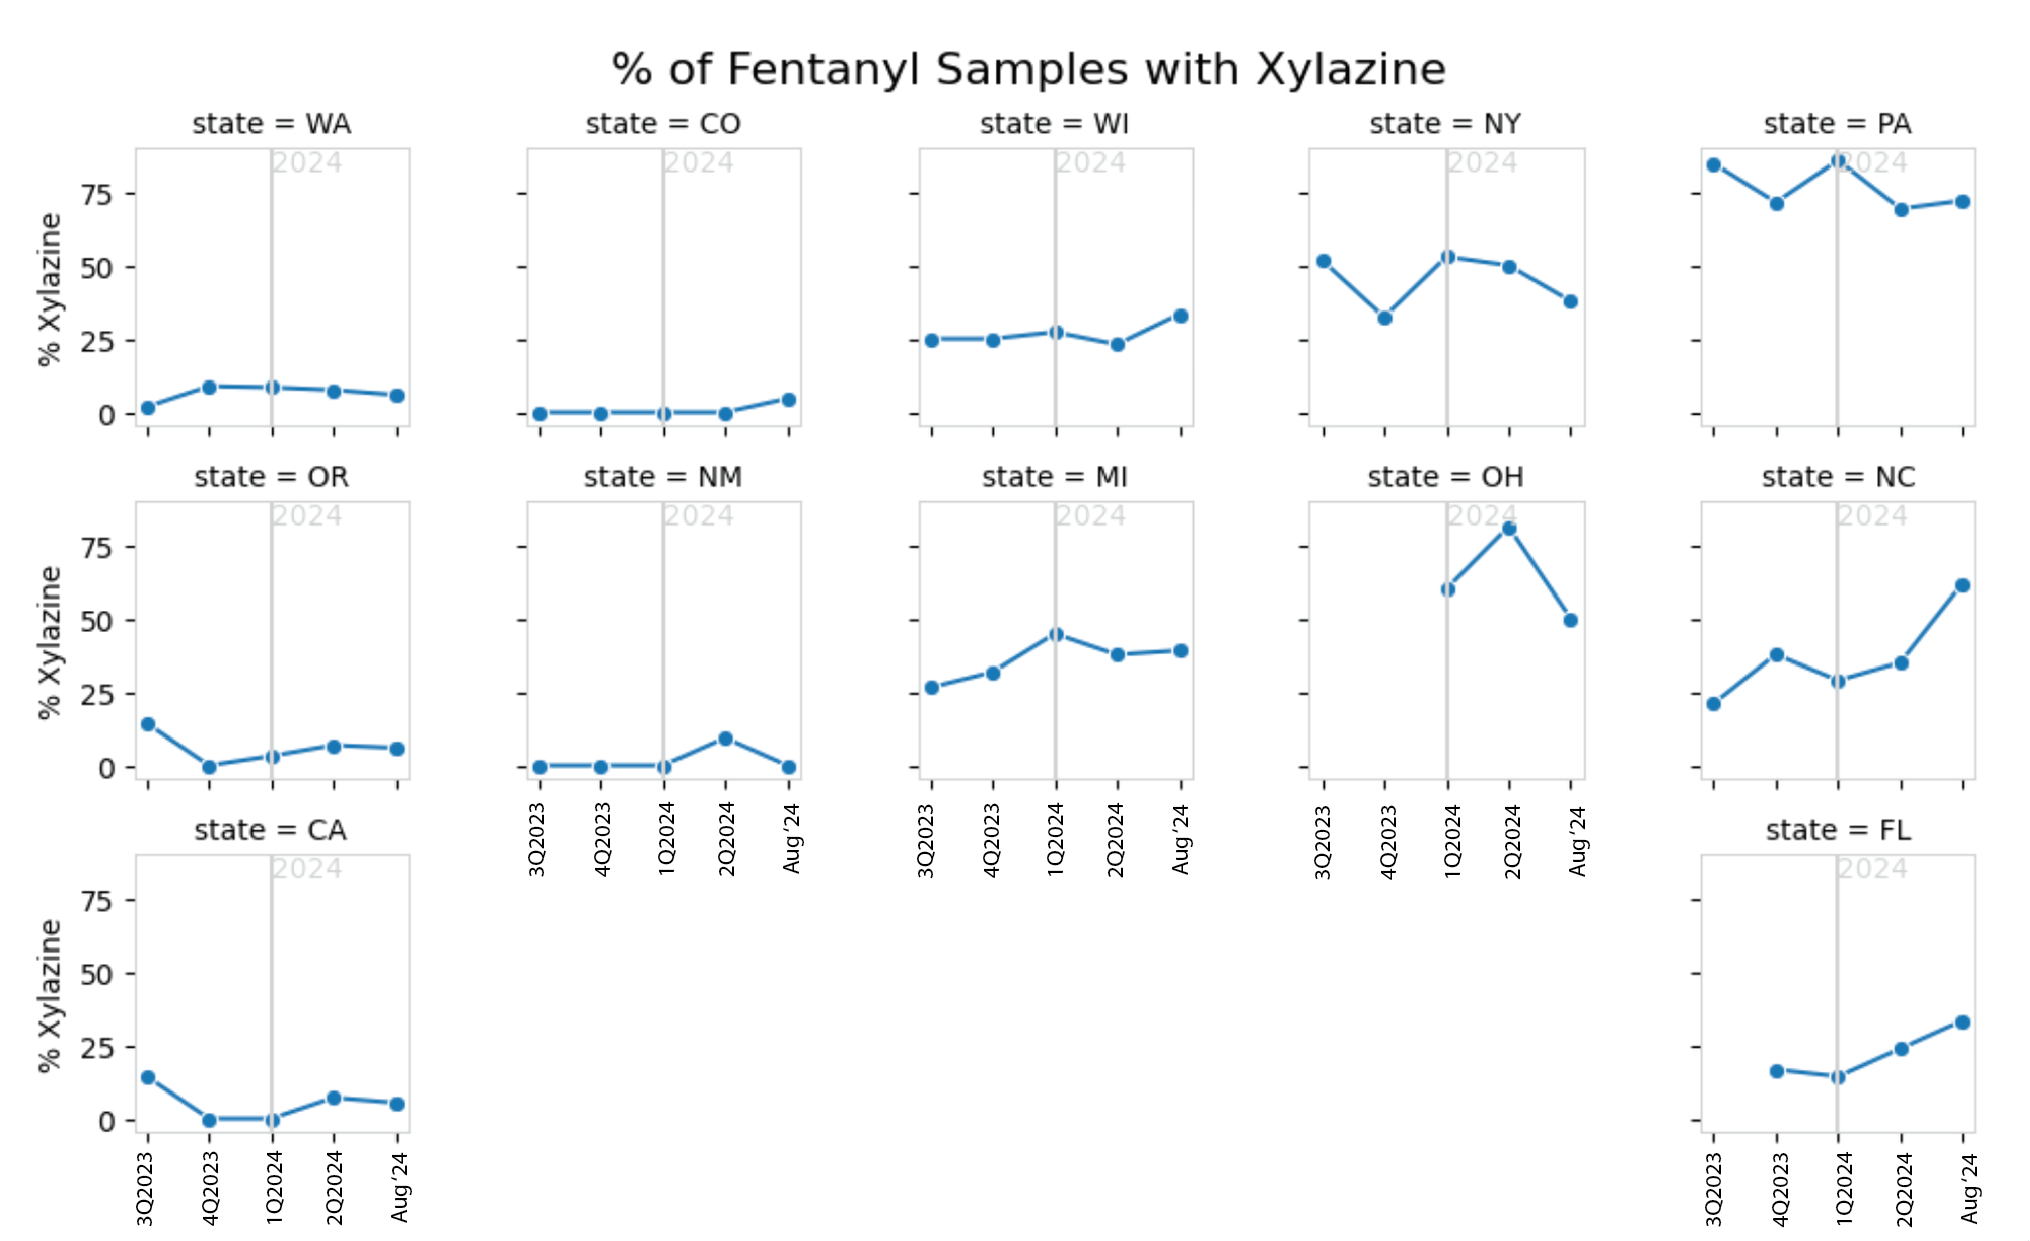
Okay, there are a lot of "but..." retorts here. Clearly, too much xylazine in dope can be destabilizing (see: Philadelphia), and there cannot be an assumption of linear benefit. Benzo dope has been around in the PNW for awhile and operates somewhat like xylazine in its role in the street supply.
Ohio proudly scheduled xylazine to CIII in March 2023, shortly before the overdoses started dropping . Just pointing this out... either scheduling had zero impact, or it flies in the face of this hypothesis.
This hypothesis fascinates us because is this a market-driven example of "safe" supply? Clumsy, not optimized, and bad side effects! It kind of feels like ethanol in gasoline: It reduces the immediate consequences but doesn't change underlying demand. But it may be meeting an underappreciated market demand – an opioid that prevents withdrawal but doesn't cause a strong high (and isn't locked up behind clinical and regulatory gatekeepers).
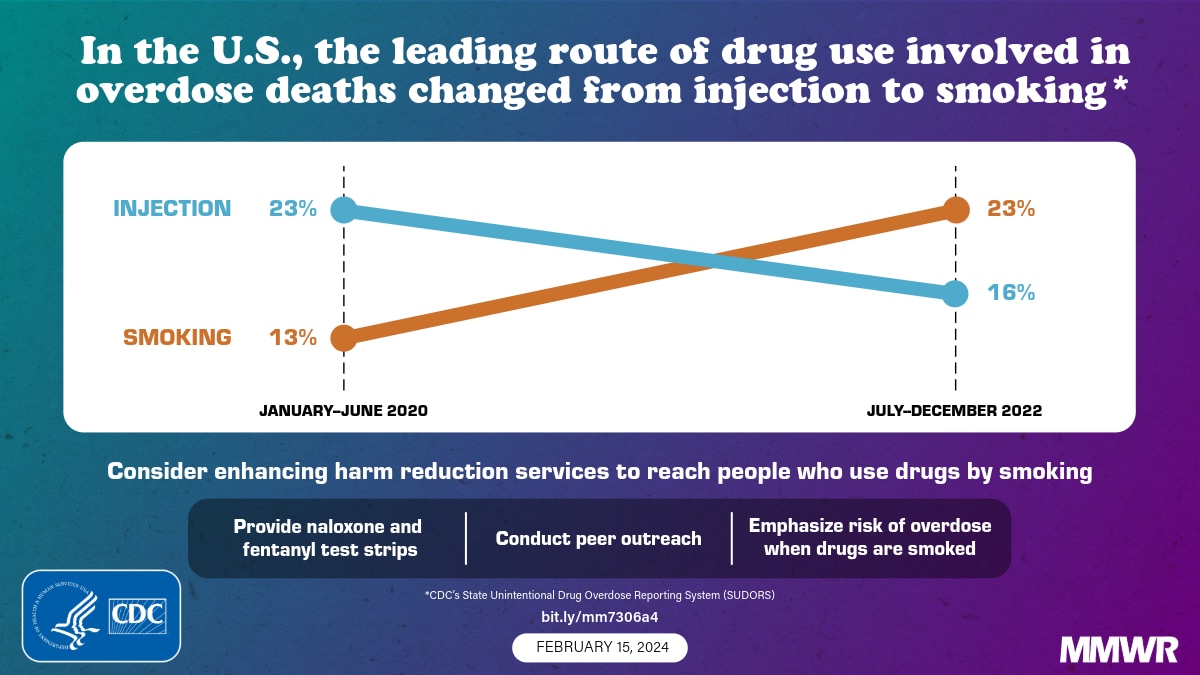
(8) Transition to smoking & price
Assessment: Plausible, but why the sudden timing?
We discussed ROA in the xylazine section, as an accelerant to reducing injection. Again, less rolls of the loaded dice. Less exposure to fentanyl per drug use episode. And there's a physical limit to how much you can smoke.
Both studies below start with OD deaths and look back at xylazine. But this approach, albeit useful, completely misses folks using other routes who don't die.

There’s another unexpected cause of the drop in OD deaths which also has to do with drug markets – the rapid drop in the cost of drugs in the last couple of years combined with increased availability of drugs. I have a number of folks that I speak to regularly about drug prices across the country and everyone has said the same thing over the past few years – drugs are getting cheaper and cheaper across the board. To give some examples, here in North Carolina, the price of meth has gone from around $80-$120/gram to $20-$40/gram, fentanyl has gone from $100-$140/gram to $50-$80/gram, and so on. Quality has gone up as well, although this began prior to the price drop that we’ve seen in the past couple of years. This is important for a number of reasons.
First off, if drug prices have been dropping for the past couple of years, any suggestion that drops in OD deaths have anything to do with interdiction efforts or the drug supply being significantly affected to where we see hundreds of thousands of people stopping use are not based in facts. If the drug supply is affected in such a way, it would almost certainly cause a rise in drug prices, where we have seen just the opposite. Second, it meshes well with research that has shown us that the removal of opioids from an person who is opioid dependent (i.e. going to jail, detoxing, etc.) increases the likelihood of overdose by quite a bit (Hartung, et al., 2023; Heimer et al., 2024). If when opioids are not used by a person who is opioid-dependent, whether due to treatment, jail, or supposed drug shortages, we would expect OD to potentially rise, not drop, especially if the shortages of drugs were such that a fifth of opioid users just up and quit. Another piece of this is that when opioids are more affordable, less people using them come up short of their habit, resulting in oscillating between getting dopesick and getting well, which is another example of something that lowers tolerance, just like treatment or jail, therein raising OD risk. I argue that cheaper durgs have resulted in more people not going into withdrawl as often due to not having enough money to get well.
Other Voices
Of course, we had to ask our favorite people at Remedy Alliance, Maya and Eliza, to weigh in.
Hmmm 🤔 it could be so many things and it seems so local and dependent on the drug supply (IMHO). For us, the drugs are absolute garbage shit, like so bad people think there’s naloxone in it. So it would track that less people are od’ing (what would they od on?) but we also saw this same thing happen in 2010-2011 when the heroin was at about 3% “purity” and it was such garbage that we had TEN heroin-involved overdose deaths in a year. But what we did have was a steep rise in other drug related deaths because people were desperately trying to not be sick and survive. And then in 2012 we got an influx of strong stuff and people started dropping. So I feel like it’s sort of an ominous dip because the drugs suck. But that’s just my thoughts. - Eliza Wheeler talking about the Bay Area
Just becasue people aren't dying from ODs doesn't mean that things aren't really terrible for PWUD right now. For those still alive, one could actually make the case that things are worse than ever. -Maya Doe-Simkins
We'll leave it on that note. Some things to be happy about, many new questions