In our published analysis we found the adjusted prevalence of fentanyl was 12.5% (95% CI: 2.2%, 22.9%) in powder methamphetamine, with notable geographic variation. Crystalline forms of methamphetamine (Chisq=57, p<0.001) were less likely to contain fentanyl: less than 1% of crystal methamphetamine (2/276).
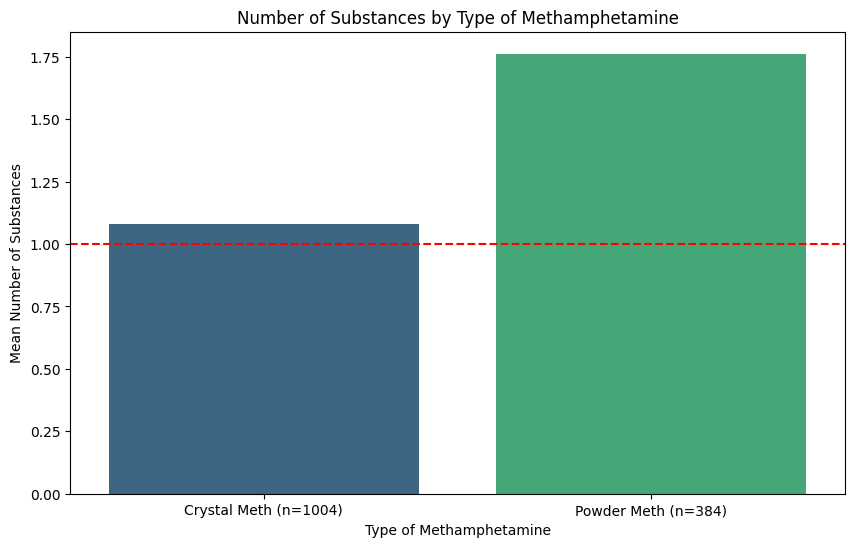
Crystal vs powder meth
The graph below shows the number of substances detected in crystal vs. powder methamphetamine samples. The red dashed line at 1.0 represents if methamphetamine was the only substance detected in that sample. Crystal meth rarely contains adulterants.
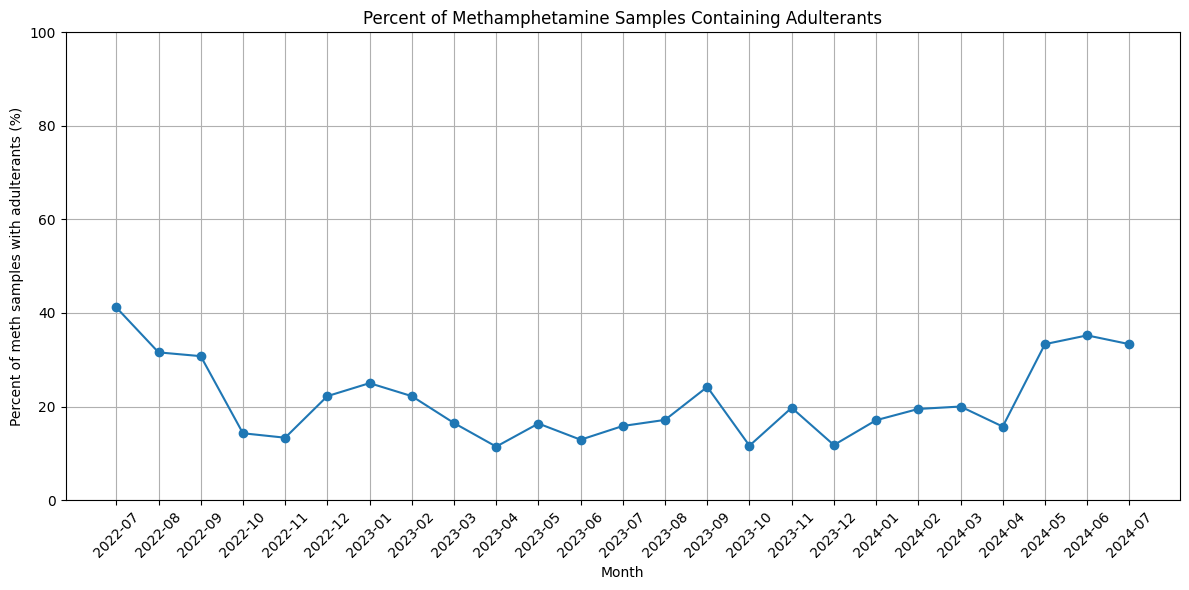
Changes over time
One way to measure meth purity over time is to look at the percent of meth samples that have more than one substance. In this graph more contamination (less purity) is higher — so generally the higher the number the more adulterated. We’ve seen an uptick in meth adulteration from April through July 2024.

Data Caveats
First, we are not differentiating between l- and d- isomers of meth.
Second, we get more more samples from NC, WA, NY, CA, and MI than other states. Geographic data below should not be construed as prevalence.
Third, people may preferentially send us samples because they caused unusual reactions. There is no possible data source on street drugs that is fully generalizable.
Fourth, some “adulteration” of meth is intentional. Combos of meth + opioids may be sold as speedballs or goofballs. We aren’t trying to make a value judgement on these, but rather trying to describe what’s out there.


