
By: Nabarun Dasgupta, Adams Sibley, Colin Miller
Do you remember this ad?

If you, like some on our team, recall seeing this ad while watching Saturday morning cartoons or after-school specials as a kid, you are currently in the highest risk group for overdose death by age. Since those seemingly more innocent times, more than a million Americans have died of drug overdose after seeing this ad as a kid.
Causation? More likely, "Just Say No" public education campaigns were ineffective. McGruff rapping with the ops as backup dancers just isn't, and never will be, it. As policy returns towards education as a pillar of response to overdose, let's be smarter this time around.
Like faddish sentencing enhancements for drug crimes, yesteryear's anti-drug campaigns never fulfilled their promise. Nevermind that these strategies have little to no supportive evidence - our society's approach to issues around drugs have been based more often on what the general population is comfortable with rather than what leads to people who use drugs to live longer, happier, and healthier lives. Education is key, just not in a, "this is your brain on drugs," kind of way.
In this post we follow up on our last newsletter where we noted that middle-aged Americans were making up an increasing share of overdose deaths. We'll go deep into what changed age-wise between 2022 and 2024, and tie it back to education.
TL;DR: There are clear generational trajectories, with Gen X and Millennials making up the bulk of OD deaths, and a marked lowering of overdose among Gen Z.
This is the fourth in our series on overdose declines (one, two, three).
But first, an urgent data caveat.
The Math ain't Mathing
Be careful with national OD data this month
Strong caution against knee-jerk reactions to CDC national provisional-predicted overdose death data for January and February 2025.
We are flagging something we have been hearing from independent data-watchers in June: We have strong reason to believe that the recent CDC NVSS national overdose mortality predictions are overestimated. Specifically, we can see data aberrations due to an algorithm revision in February. NVSS historical data going back to 2018 have been quietly revised. The new version of the prediction algorithm overaggressively corrects for pending autopsy investigations in some months because it is built on years when overdoses were increasing. This causes an artificial bump in January and February. This algorithmic bump is so big that it appears to (incorrectly!!) even change the nation's overdose trajectory. It is also is visible in both 2024 and 2025 data. In even earlier years, the increasing trend obscured the artificial up-bump.
Confirmation bias abounds. The January faux increase was not due to Trump taking office or immediate funding cuts. It was just poor math. Likewise (unless the algorithm is fixed pronto), there will be an artificial forthcoming drop in ODs in March. The algo is tuned to less aggressively correct for pending investigations starting in the third month of each year onwards, and therefore it will make any January vs. March 2025 comparison look like a massive decline artificially. And charlatans will queue and clamor to take credit.
🙏🏽 Thanks to Lori Post at Northwestern University and David Holtgrave at the New York State Health Department for bringing this to our attention. We'll provide more details as we get clarity, but for the time being, we feel that the purported increase in January 2025 and that which be will reported for February 2025 are unreliable.
And yes, thank you for continuing to make us aware of local increases in (non-fatal) overdoses in Spring 2025. We noted it in last month's newsletter too. The unregulated drug supply remains highly variable. There will be spikes. But, we still believe the overall trend is downwards. We believe the algorithm change is a genuine flub. It does not bear the fingerprints of being intentionally nefarious. Rather it is 🤦🏾 supremely ill-timed, and operates largely independent of real localized increases in overdose in early 2025. Stay tuned as we unravel this mess.
The Long View
We hear you: Drug overdose deaths may be down from their peak, but there are still a lot of people dying, and we've lost so many. How many? About 1.4 million people we love since 1979. So pardon us if we aren't exactly exuberant, but cautiously hopeful. It didn't have to be this way. The War on Drugs started in the early 1970s. Here are the receipts:
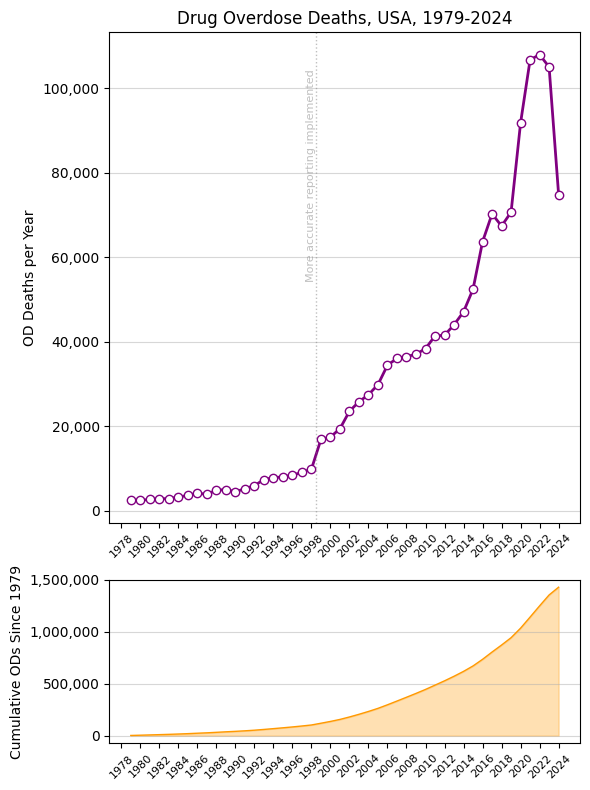
Here's another way to look at the 2023-4 decline. We are down about 29% from peak in 2022, but we are still about 4 times higher than we were in 1999.

On the graphs above, the migration from ICD-9 to ICD-10 in 1999 for all deaths generally led to more accurate reporting of overdose mortality specifically. And yes, the US population increased 20% over the last 25 years, from 279 million in 1999 to 335 million in 2024. In 1999 there were 16,825 overdose deaths, or about 6 per 100,000 population. In 2024, we estimate 74,787, so a rate of 22 per 100,000, for a population-adjusted 3.7-fold increase. Without taking the population change into account, on an absolute level it's a 4.4x increase in the OD death count.
Three Data Challenges
Before going on to generational findings, our analysis of national overdose mortality data had to address three significant data limitations that could obscure true trends:
- Demographic Granularity: CDC NVSS predicted data, often used for policymaking, lacks demographic detail for age-specific analysis, and is also heavily smoothed. Therefore, to get at underlying demographics, we rely on another CDC data product, CDC WONDER. We combined that with a third data product, CDC SUDORS. SUDORS is about 40 states/jurisdictions that do a manual review of overdose deaths, filling in the blanks with additional contextual data not reported in the other sources.
- Data Suppression Rules: CDC WONDER suppresses cell counts between 1-9 cases to protect privacy, meaning that deaths among youngest and oldest age groups may not appear in public datasets. Put another way, if there were between 1-9 deaths per year within an age group, we won't know the exact number. To address this, we used the number "5" to backfill suppressed values. (You won't see integers 2,3,4,6,7,8,9 in our tables.) So in our tables and code anytime you see "5" you can tell the number was imputed. The impact is minimal: A few dozen cases amidst 70,000.
- Incomplete 2024 Data: Death investigations for overdoses in the final months of 2024 were still pending at the time of analysis, leading to artificially low provisional counts. Historical data shows that 12-month provisional counts are typically 95-97% complete after a 5-month lag. Using the 2023 historical completion rate from major states with longer lags like California, Texas, and New York for May, we adjusted 2024 totals upward by 4.2% to account for pending investigations. Technically speaking: In making inference, we assume the percent distribution of missingness-due-to-pending within strata of a category is random/uniform. In other words, it would be out of the ordinary if our results varied by more than 5% from the eventual final data within each level of a given category.
We used these standard definitions of generations.
A final methodological caveat – we extrapolate year of birth using the simple equation: (year of death) - (age at death). This isn't perfect because people aren't born uniformly throughout the year, and also because this method could misclassify exact years. Anytime you see a year-of-birth, it's fine to think of it as ±1 year.
Just for kicks, there were more live births in the United States in 2023 during summer months, peaking in August. So the calculation we are doing is tenable.

As always, overdose death data have known limitations.
Talking About My Generation
(obviously, The Who)
We'll come back to the "Who?" in a bit, but first let's finish up the methods.
Scientists studying population trends in health (like changes in overdose mortality) often use an age-period-cohort (APC) approach.
Age effects are changes that happen to individuals of a certain age regardless of the point in history.
Period effects are changes that happen to everyone at a certain point in history – because of major events, like policies shift, etc.
Cohort effects are changes that happen to a group born around the same time because of shared experiences in their development.


Image 1 (AGE): People in their 70s have higher rates of heart disease: Cardiovascular risk naturally increases with age. Image 2 (COHORT): People born in the 1940s have higher rates of mesothelioma: They were of working age when asbestos in construction was at its peak. Image 3 (PERIOD): People who lived through the 1980s (regardless of age) had a higher risk of skin cancer than those who lived before: Ozone depletion accelerated during this time. Images courtesy of @neonbrand, @strangehappenings, and @perlamutrs via Unsplash.
Our task is to disentangle these effects in the context of overdose declines.
#example #tiktok #insta: If we observe that 20-year-olds use social media more than 60-year-olds, is this because younger people naturally adopt new technologies more readily (age effect), because social media platforms have become more popular recently (period effect), or because digital natives born in the 2000s grew up during the rise of smart phones (cohort effect)?
Here are a few key papers on overdose trends using APC with generations: Hall 1999, Huang 2018, Jalal 2020, Fujita-Imazu 2023, and also related is Post 2025.
Our approach uses the same APC framework but differs in an important way: While the authors above use statistical methods to disentangle the effects of age vs. period vs. cohort over long periods of time, we are isolating our analysis to a three-year window (2022 vs. 2024), effectively freezing out age and period effects.
With such a narrow observation window, cohorts will have aged minimally (just 2-3 years), and all birth cohorts experience the same period effects (the same policy changes, drug market conditions, etc.). This design isolates what we're most interested in: birth cohort-specific responses to recent events - essentially measuring whether different generations responded differently to whatever factors drove the 2022 vs. 2024 overdose decline.
Generation Data
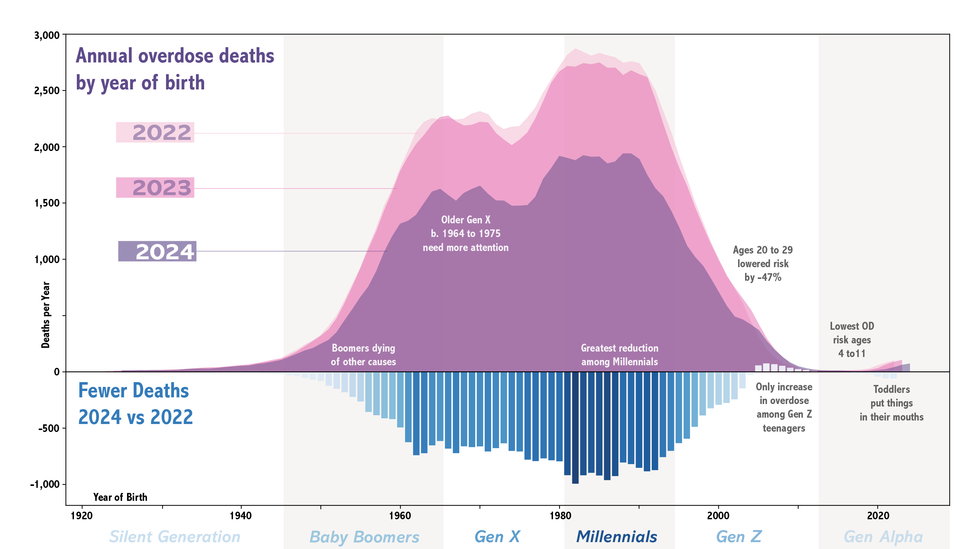
After addressing underreporting and other sources of known systematic data bias, overall overdose deaths in the United States declined around 30% from 2022 to 2024. The declines were experienced across the board in terms of age, place of death, urbanicity, and race, with one notable exception (scroll down) in Gen Z.
🤓 Our data, code, modeling, graphics, and assumptions are detailed here.

The biggest takeaway is that overdose deaths in 2024 were highest among Millennials and Gen X, with these generations comprising 71% of overdose deaths. (detailed table)
Another remarkable thing is how uniform the gains (i.e., reductions in overdose 2024 vs. 2022) have been across the lifespan, with 25% to 35% declines by birth year.

How can we independently verify the generational pattern? This study from Verdery et al. at Penn State looked at intergenerational relations of kids who had lost a family member to overdose. Grandparents come in second to aunts and uncles, substantially more than cousins and siblings in the same generation. And yes, parents too, but more grandparents. This was in 2019 and these numbers would likely be higher now. But, it provides an independent reality check on the generational patterns we observe in national overdose death data. (For the sake of completeness, here's another study that calculated the burden differently.)

Okay, so that generational spacing checks out with the mortality data. But grandparents, really? Starting in the 1990s, the carceral devastation inflicted on Black parents led grandparents to step in to raise another generation, reconfiguring kinship and community ties. What happens to families when that generation of carers are also wiped out? Profound changes. And lengthening existing penalties for drug charges? The length of a prison sentence has minimal additional deterrent effect, but it magnifies and extends the familial damage caused by separation.
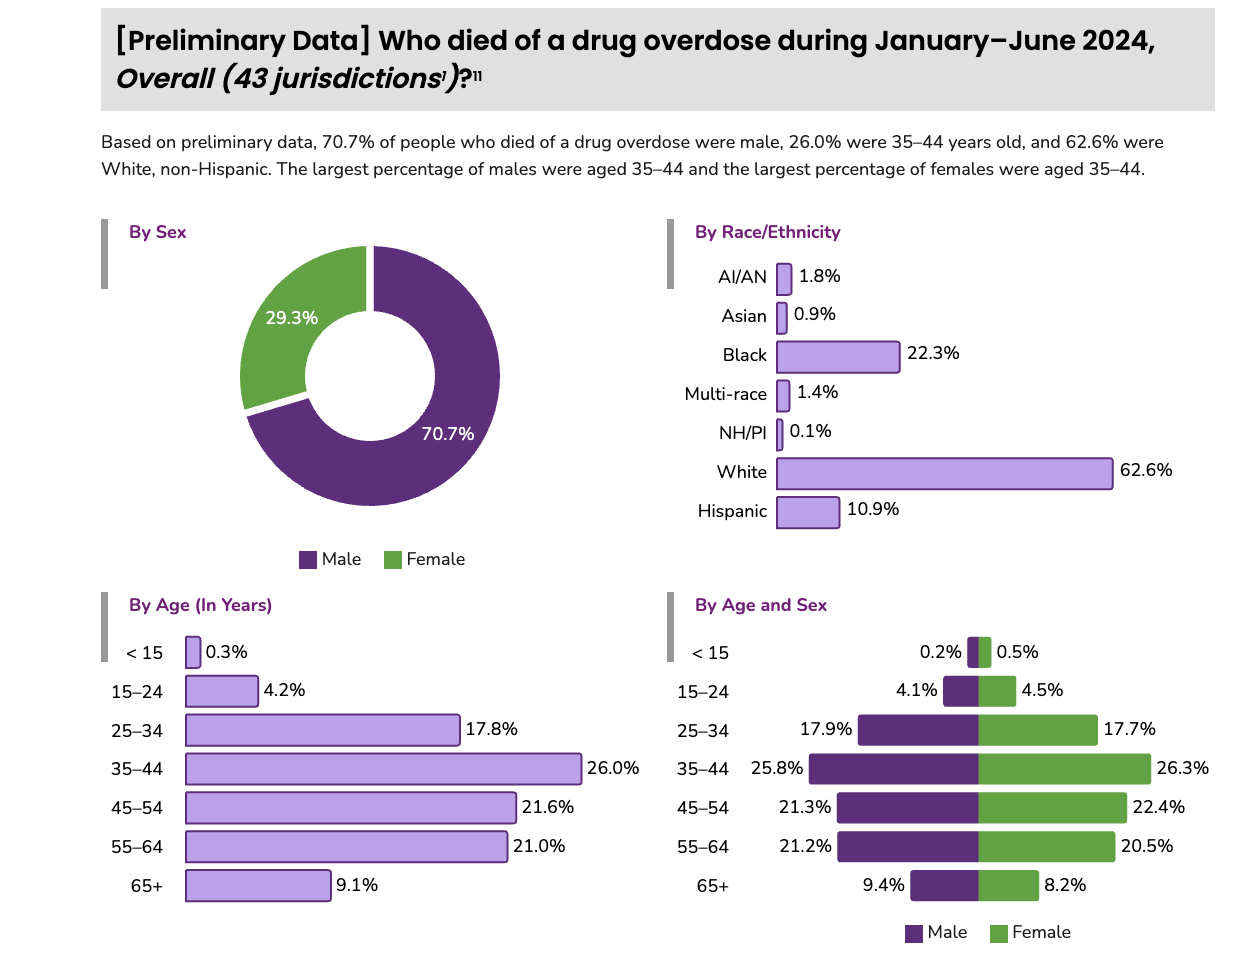
Okay, let's look at one more data source to triangulate. SUDORS can provide detail, such as the age distribution we observed above holds for both men and women, even though the former make up 71% of all overdose deaths.
An old idea that no longer holds
With drug cycles in the United States, generational effects are well-documented. This brilliant paper by Judith Ryder et al. describes the complex generational impacts of crack cocaine on women and girls in the 1990s. Check out this hilarious paper from 1972 talking about "the Beat Generation" that cites Jefferson Airplane lyrics. Amphetamine use disorders were documented to be specific among those born between 1954 and 1962. You get the picture.
There's a trope in American addiction research, that drug cycles alternate between uppers and downers, and that each cycle takes about a decade. This concept can be traced back to the late David Musto, historian at Yale. (In the linked article from 1986, he also weighs in on Nancy Reagan, who we'll get to in a moment.) What's different in the last 40 years is that cycle lengths have changed to the point that they overlap. Increasing interdiction pressure, rapid chemical innovation, and efficiencies in global trade have shortened the cycles involving any single substance. Over the last 30 years, what is called the "opioid crisis" is really a series of smaller cycles that overlap. And in our desire to make sense of the macro pattern, age-cohorts are a hidden driver that we don't often think about.
In 2012, peak opioid analgesic prescribing, it was the Baby Boomers that were most likely to die of overdose, a majority from Rx opioids. Around 2013, however, we documented a decline in overdose deaths among Baby Boomers, with an influx of heroin overdoses among Gen X, a shift rightward:
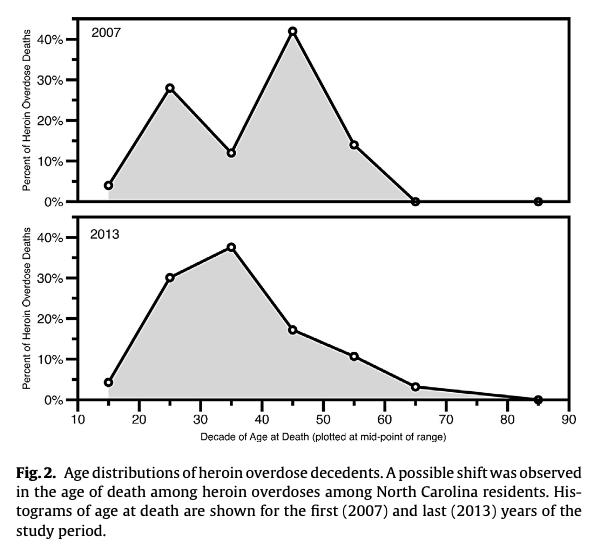
Gen X still seems to be now be dying from heroin and unregulated fentanyl, and also Millennials. What has changed is that Gen Z seems to be decreasing overdose deaths at the same age when their parents’ OD risk was increasing. This is a very big change that challenges the brain and animal models that rely on just drugs x age. Instead, we make the case that it is drugs x age x time.
It may seem obvious but let's be explicit: The type of people dying from overdose during the last 3 decades has evolved. The overly simple narrative of [Rx opioids ➡️ heroin ➡️ unregulated fentanyl] fails to take into account that these things were happening across 4 successive generations.
Drug availability has something to do with it, but markets also respond to consumer demand. Gen X had access to Rx opioids, heroin, and fentanyl. Millennials it was more heroin and fentanyl. For Gen Z, prescription opioids are not the drug of choice, neither is fentanyl. Possibly, witnessing their parents' and grandparents' generations dying from overdose may be a strong deterrent. (Stronger than any educational campaign.) At same the time, bearing witness may have induced intergenerational trauma and substance use, as Ryder points out with crack.
In short – both things can be true, on an individual level parental substance use and incarceration can lead to trauma and generational cycles of problematic use (hello, epigenetics?). At the same time, on a population level, there seems to be a kind of deterrence-through-example effect.
Population Dynamics
The model that predicted overdose declines had a strong component of reducing new initiates. This seems to jibe with the data we are seeing above, but there is more to it.
Building off of our graphic above, we believe 3 dynamics are happening at the same time:
- Gen X and Baby Boomers are ageing out of opioid use. For those surviving, substance use treatment is critical, but not all feel comfortable accessing it. Others are dying of "competing risks" like cancer, car accidents, strokes.
- Gen X and Millennials are engaging in less risky use, including having naloxone on hand, not using alone, etc. and face less (self-)stigma in seeking out treatment.
- Gen Z's tastes have shifted, and they've learned from the experience of heartache to avoid the unregulated drug supply.

Please stop saying "there is nobody left to die." It is horribly disrespectful to all those families who will lose loved ones this year. At the same time, it discredits the choices being made by younger generations to interrupt 4-generational grief.
Are the kids okay?
Something unexpected also shows up in the data, something subtle. There's one group in which OD deaths increased from 2022 to 2024: Younger Gen Z.
Before we even start, let's preemptively get this out of the way: Fentanyl-in-weed is not a concern in the United States at this time. (Burning fentanyl in a joint or pipe likely destroys most of the molecule; commercial vapes don't typically get hot enough to vaporize fentanyl.)
Taking the historical context into account, Gen Z has different drug tastes than their older relatives. Older Gen Z has the highest rates of marijuana use compared to all other ages. NSDUH (Page A-4, Table A5B) pegged past month cannabis use at 36.5% among 18-25, compared to 20.8% of 26+ years-old. Albeit lower prevalence, MDMA also shows a similar age preference. Stories about declining alcohol use among Gen Z tend to come out every Dry January. And over in the United Kingdom we see strong generational preference for ketamine.
Again lessons come from the consumer goods space. Coffee consumption is lower among Gen Z (but they do love their cold brew), while hard seltzer is a slightly older crowd. Millennial dads used to drink the most orange juice, but there's been a sustained drop. So it should come as no surprise that opioids also could have generational and evolving tastes. What happens in the regulated market for psychoactive drugs has parallels in the unregulated market, duh. And the molecule itself doesn't explain everything.
But wait, are overdose deaths increasing or decreasing in Gen Z? Turns out there's a stark divide within Gen Z.
A Disturbing Exception
What you are about to read applies to less than 2% of OD deaths: The only age group where ODs increased between 2022 and 2024 were 15-to-19 year-olds. It's also the age group where prevention messaging and education would likely be targeted. We need to get this right before we hire Madison Avenue to make slick fentanyl scare ads for the kids. We've been here before. It didn't work out well.
🍳
Did you even know D.A.R.E. has an drug emoji? Ha.
Below are two behind-the-scenes plots of the same data in the graphic before, but different visual emphasis. In the top graph, the vertical bars are number of deaths in a given age-year, and horizontal is age-at-death. In the bottom graph the horizontal axis is birth year (i.e., cohort). The red line is the same as the blue bars in the graphic at the top of the page, the count difference between 2022 and 2024.

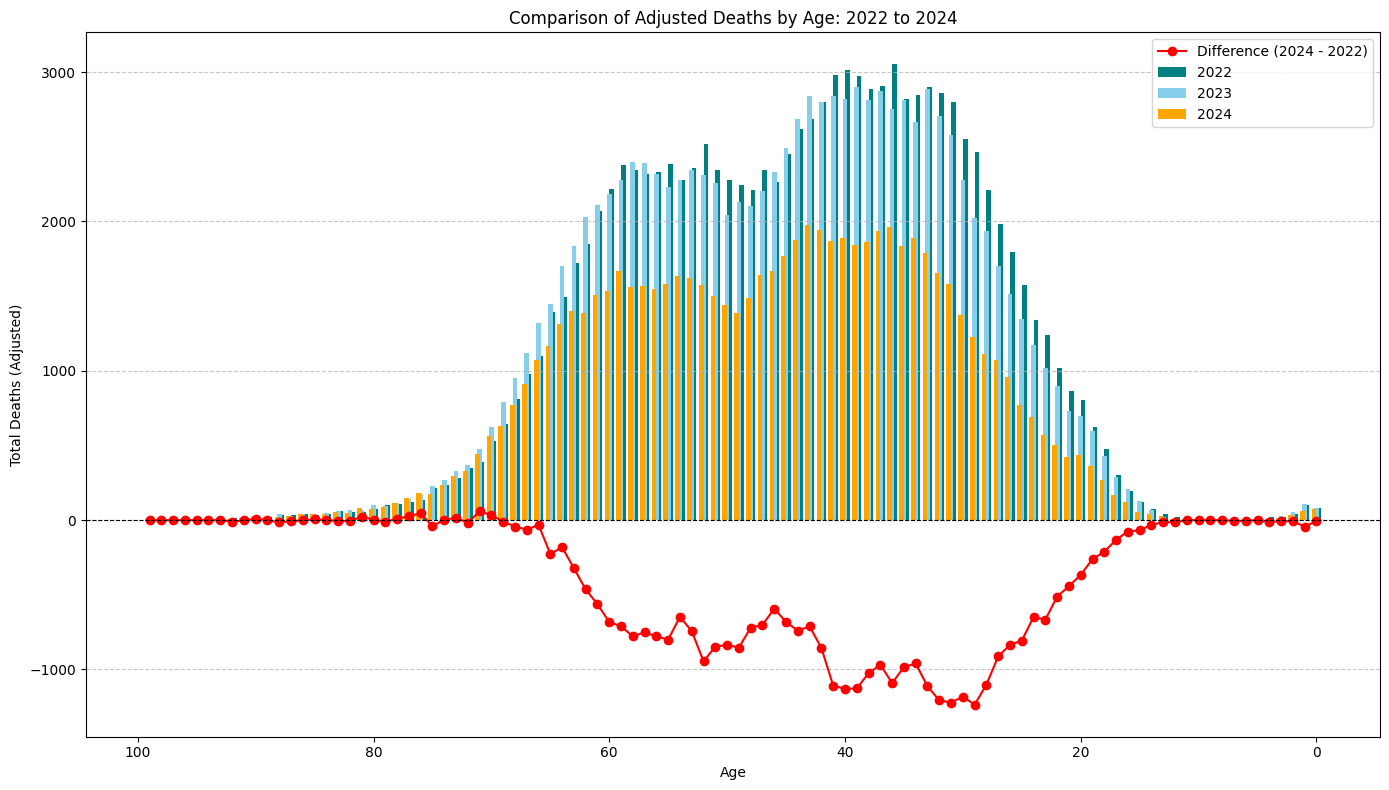
Except, zooming in, there's a spot where the red lines are different:

From 2022 to 2024 this is the only cohort where overdoses increased. The increases are among those born 2005 to 2011. Literally, anyone born any other year in the last 100 years would have been in an "improving" category in 2024. This mini age cohort comprises only 1.4% of all overdose deaths in 2024. But these estimated thousand young lives weigh extra heavy. Kids born 2005-to-2011 would be 15-to-19 years of age in 2024 when they died of an overdose.
For the data nerds, here's the full table:

The ages and years in the table above belie a specific artifact arising from categorizing a continuous variable. This is what is causing the difference between the two graphs above, plotted by age-group versus birth cohort.
(As a reminder, 5 in table cells means there were less than 10 ODs per year for that age but we don't know precisely how many.) In the overdose data, categorizing continuous age in 5-year increments obscures a birth-year effect. Between 2024 and 2022, OD deaths increased for those born from 2005 to 2011 (pink & red cells in Deaths Difference column). The category jump works like this on cells colored dark red: Kids born in 2008-09 (red cells) aged 13/14 in 2022, would go on to be 15/16 in 2024 at time of death, pulling them out of 10-14 category, and landing in age group 15-to-19 (yellow cells).
Looking at the Deaths Difference column we can see the impact of the age-group boundary: An increase (+16) among those born in 2009 is swamped out by a large decrease (-175) among those born in 2003, as the yellow age-group boxes in the table shift downwards. Hence, older Gen Z seems to have adopted strongly protective behaviors against overdose, whereas we cannot say the same for all of younger Gen Z where ODs increased.
Stated another way, putting people into 5-year bins while doing a 2 year comparison, what we are actually saying is "What would be the difference in ODs if everyone stayed the same age between 2022 and 2024?" This is like measuring the depth of a river from a fixed dock (okay), versus measuring from the deck of a boat moving down the river (better).
So those kids would have been in high school or just beyond when they died, 15-to-19 years-old. Looking back, they would have been in middle school when COVID emerged in the United States in April 2020. And by "school" we mean Zoom classroom.
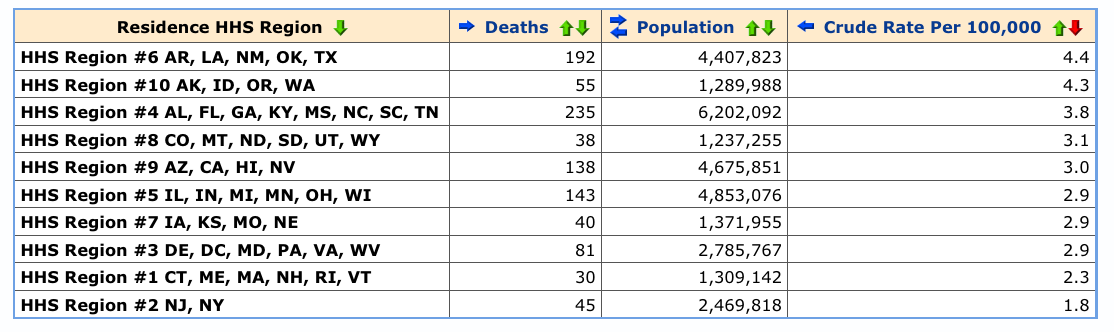
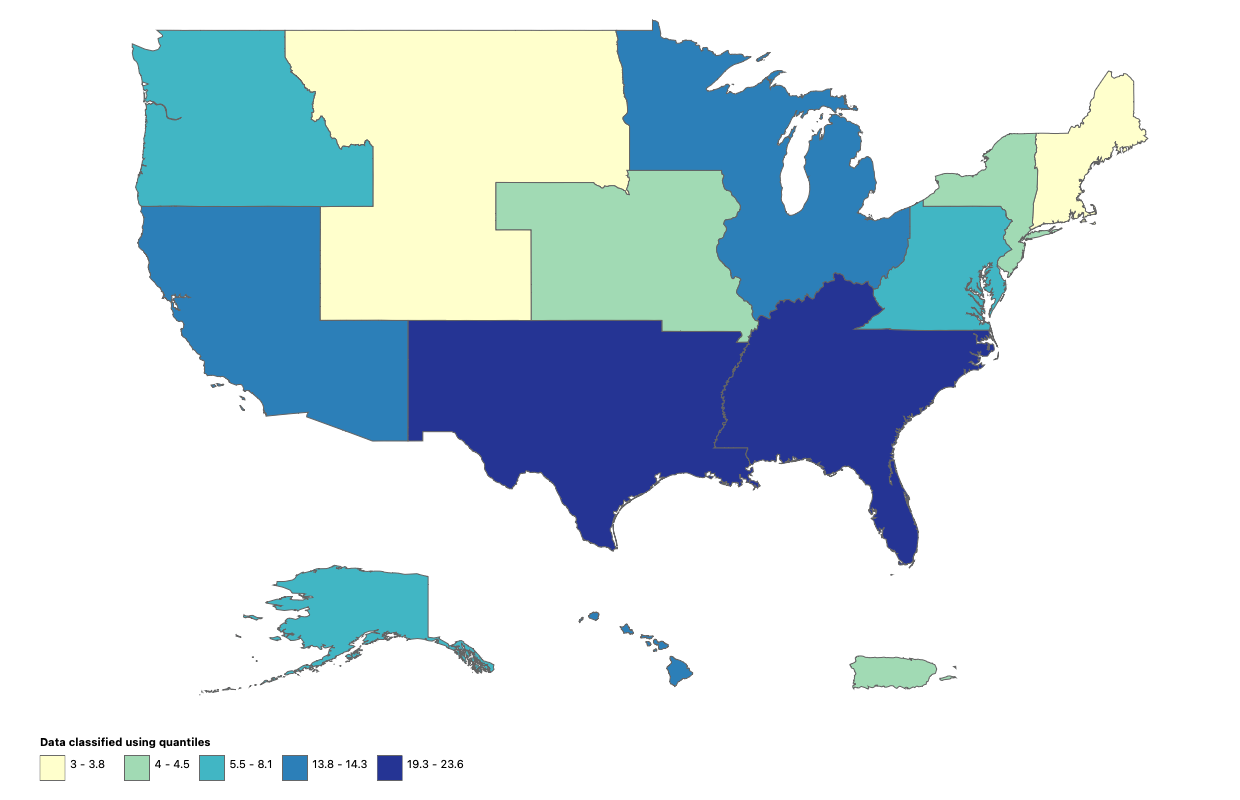
And before y'all jump to conclusions, this isn't just a byproduct of COVID-mandate lockdowns. The highest burden is in the Sun Belt where lockdown and school-from-home policies were more relaxed. So maybe this isn't a COVID/school effect? Or maybe it is a sign of broader COVID-related social disturbances? Or cannabis legalization having a protective effect in other states? The numbers are small and squishy (albeit heartbreaking) so let's not hallucinate a narrative based on thin data.
Where do we go from here?
Juventud, divino tesoro,
¡ya te vas para no volver!
Youth, divine treasure,
You leave, never to return!
- Rubén Darío
Many of us grew up attending D.A.R.E. presentations in the school cafeteria, Nancy Reagan's "Just Say No" campaign still ringing in our ears. Maybe you remember police officers warning about tattooed gang members lurking just outside of school grounds eager to offer you free pills. Maybe you remember signing an abstinence pledge. Or maybe you remember singing these catchy lyrics with your whole class:
D! I won't do drugs!
A! Won't have an attitude!
R! I will respect myself!
E! I will educate me!
Years later, researchers would demonstrate that the D.A.R.E. program was largely ineffective in changing behavior. Perhaps the only positive outcome was getting a t-shirt (inexplicably an adult large?).
We can laugh at the absurdity of growing up in the D.A.R.E. generation (as kids, we joked that DARE stood for "Drugs Are Really Exciting"), or we can bemoan that politicians on both sides of the aisle poured untold resources into an ineffective public health program. But neither solves the challenge we face now: Keeping young people safe from drug-related harms.
Although the "Just Say No" experiment may have been a failure, Nancy got it right when she said "If you even save one life, it's worth it." But if saving one life is truly the goal, then good intentions need to be coupled with good evidence. Even – especially – if that evidence may be uncomfortable.
We need a divider here because we are decidedly not childhood substance use specialists. Amongst our team are scientists and parents. And while we are not experts, you better believe we will use our understanding of science to protect our kids in any way possible. And we have a duty to point out what doesn't work. A couple of weeks ago, one of our kids came home from 5th grade with this certificate. Sorry WCPSS, this is not enough.

Half our team has schoolage kids, elementary to high school, whom we cherish. This is serious and deeply relevant to us personally. Here are our learnings from the scientific literature:
- Substance use and trauma are intergenerational phenomena. If we're serious about keeping kids safe, we need to engage families.
- Delay regular use of drugs and alcohol into adulthood. The evidence is very clear that the the longer kids delay from regularly using substances, the less chance of later problematic use. This is especially pronounced for kids with other mental health things going on, adverse childhood experiences, family histories of substance use issues, and difficult family situations.
- Teenagers are risk-takers. This has been true for all of human history – it's not a fact we can wish away. For youth who do experiment with opioids and other drugs, early intervention and treatment (including medications) should be easy to access, supplemented with age-appropriate and realistic education. Look, exactly nobody is saying to teach injection in middle school. Nobody. Age-appropriate curriculum can start early to dissuade sharing of any medications. But let's not kid ourselves that a one hour 5th grade scare lesson, no matter how well-intentioned, is going to lead to "success throughout your life."
- Stigma is unhelpful. Mental health and substance use stigma keep adolescents from seeking help for difficult thoughts and behaviors they're only beginning to understand. Rather than relying on scare tactics that failed the D.A.R.E. generation(s), parents and teachers should empower the resilience and decision-making capacity of youth. Peer-pressure is real, and complicated. It extends way beyond drugs. And yes, sometimes coercive approaches can help. But they should not be the default.
A former member of the UNC Opioid Data Lab team, Chris Ringwalt, studied prevention in elementary schools for decades. Retired now, his evaluation of D.A.R.E. from 1991 remains the paper of record. More recently, the Safety First curriculum from Stanford University pediatricians is one of the only we are aware of that has a proven track record. Materials available in English, Spanish and Chinese.
What Safety First Does
+ See abstinence as an important, and primary, strategy in reducing drug harms.
+ Empower teens to make healthier choices through accurate information.
+ Recognize that some teens will try drugs.
+ Encourage teens to take steps to reduce the potential harms of drug use.
What Safety First Does Not
- Encourage or condone teen drug use.
- Teach teens how to use drugs
- Judge teens who use drugs.
Overdose education in schools may make some squeamish, but in the spirit of Nancy, isn't one life worth the effort?
Conclusions
In this current moment, we are seeing generational shifts in drug use and harm patterns. At the same time, we have heard from many in law enforcement who feel strongly that border interdiction, longer prison sentences, and education are the three primary pillars for reducing overdose deaths. Politicians have floated mass education campaigns against fentanyl; 🧟♂️ D.A.R.E. attempting to reinvent itself with fresh government funding and cringe acronyms like "keepin' it R.E.A.L." ("Refuse, Explain, Avoid and Leave"). Tastes change. The “addictive” nature of a molecule doesn’t explain everything. Social and demographic factors matter. Education is important, but naïvely overreliant on the past. If we are to keep things going in the right direction, we need to go about it smarter than generations before. We owe it to our kids to get this right.